I've been using a free air impedance sweep with the driver cone held out (+ve direction) and held in (-ve direction) as a proxy to measure a driver's Le(x): inductance variation as a function of cone/voice coil movement.
A primer is here:
"Le(x) is a driver test result that shows how inductance changes based on the position of the voice coil in the magnetic gap. Generally, better performing drivers with complex motors do not have substantial changes in inductance throughout their operating excursion, while inexpensive low end drivers with simple motors have much higher inductance with coil inwards and lower inductance with the coil outwards. Le(x) related distortion is a major product of intermodulation distortion and amplitude modulation distortion. This is a form of distortion that is based purely on excursion, and is more of an issue with louder output and higher signal complexity.
There are two ways of displaying Le(x) results. One way is a curve with Le on the Y axis and MM excursion on the X axis, with 0mm in the center showing the at-rest inductance. This is how the Klippel testing system displays the results. The other way is an impedance vs frequency plot with impedance on the Y axis and frequency on the X axis. These are created with the driver cone clamped or held in place, and several plots are needed at various excursion positions. This form is much easier to do with cheaper testing software, and it is what we are showing below.
Each of these Le(x) plots is comprised of 3 impedance curves. One is at rest, one is at the full inward Xmax position and the other is at the full outward Xmax position. Of course, the mm of cone offset depends on the driver's available Xmax. In executing this test, to avoid inaccurate results, the operator has to be very careful of not exceeding the inward or outward excursion.
In these 3 curves, the one with the driver at rest is not clamped or held, and therefore has the full free-air resonance peak shown. The 2 curves with the driver held in position typically mangle the resonance however. As such, the curves are only accurate above roughly 300 or 400 Hz and grayed out below that. For drivers 7" and under, the typical change in Le impedance curves happen above 300 Hz anyway, so this is normally not a limitation.
Note that the vertical scale of these plots is relatively compressed, so minor curve offsets are relatively major in audibility at high output levels. Also keep in mind the expected bandwidth of the driver in question. Smaller drivers are expected to operate higher in frequency and top end Le(x) performance becomes more important in these cases. Along with harmonic distortion sweeps and response curve usability, Le(x) plots can also help you decide on an optimum crossover frequency.
Ideal performance in these test results would be all three curves falling on top of each other at least an octave past the driver's usable frequency range. (or up to 8-10kHz in the case of a wide/full range driver) Poor results would be three greatly offset curves way down into the lower midrange."
Reference:
http://www.zaphaudio.com/Le(x)/
Klippel has also written about it:
Reference: pending…
So here are my test results for various drivers.
10”
Peerless 10" woofer- model 830668 (8 ohm driver)
Green- cone at rest (as evident by peak at Fs)
Pink- cone held in
Blue- cone held out
Bowers and Wilkins 10" woofer from 801 D4 loudspeaker (8 ohm driver)
Bottom curve (pink)- rest position
Blue curve - cone held inwards
Orange curve- cone held outwards
12”
Peerless / Tymphany 12" woofer, model 835017 (4ohm driver)
Green- cone neutral
Pink - cone held in
Blue- cone held out
8”
Purifi 8" midwoofer, model PTT8.0X08-NAB (8 ohm driver)
Green - cone neutral
Purple -cone held in...
Green - cone held out
Commentary:
I use the same impedance scale 0-150 ohms, and 5Hz to 20KHz for all.
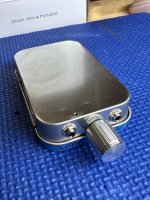
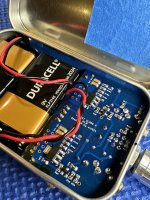
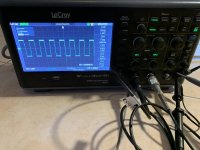
It is quick and easy to do with today's available tools eg. Woofer Tester 3 or DATS or impedance jig for ARTA/REW.
As time allows, I will editing the original post with other drivers.
As usual these tests are from the drivers on my shelf, no Amazon affiliations or kickbacks from manufacturers allowed and advertisement free.
This is for learning/shared understanding only. If you want to send me a driver for testing- please don’t. One of the great things about this test is that you can do it yourself- with relative ease (no need to build an enclosure) and it takes minutes to do (unlike harmonic distortion testing which takes hours)
Comments on the usefulness, relative importance of IMD and AMD, and limitations of this testing method are welcome.
Suggestions for other drivers welcome.
Also, feel free to add your drivers.

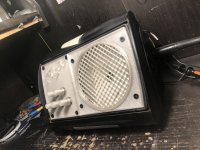


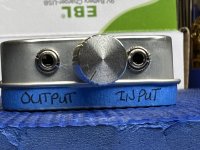
![IMG_1742[1].JPG](/community/data/attachments/1116/1116353-fa7512efeb8498ec3b9b7b68780af0b2.jpg?hash=-nUS7-uEmO)