Hi all,
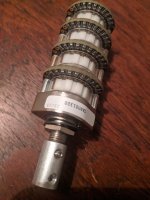
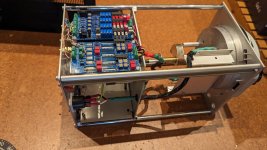
I've recently bought a Peak atlas DCA Pro transistor tester and after playing with it for a while, I thought I'd have a go at tweaking some LTSpice models based on actual measurements. I've started with the KSC1845 / KSA992, since I have a bunch and they seem to be popular around these parts.
What I've done is based mostly on Bob Cordell's superb book "Designing Audio Power Amplifiers" and various DIYA contributions from Keantoken, Andy_C, Dave Zan and many others to whom I'm forever grateful for sharing their knowledge. Please note that this is my first attempt and I'm far from an expert, so the usual disclaimers apply: as far as I can tell, the models are much closer to reality than the stock ones (*), and so far they've worked fine in all the various simulations I've used them in, but I'll take no responsibility if using them sets your house on fire or something. Comments and corrections are of course welcome.
I don't want to make this first post too long so I'll give more details later (of course Bob's stuff is published material so I'll just go into things he doesn't cover or I've done differently), just a few initial comments to get things started:
- At the moment I have 10 x KSC1845 and 15 x KSA992. First I took a quick hFE / Vbe measurement of all of them and picked the ones closest to the average to measure in more detail and base the models on. They are both gain group F and have an hFE of around 400.
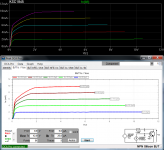
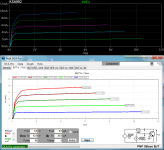
- As you can see, both have quasi saturation. It is well known that LTSpice's qs modelling has its problems, some of which I'll go into in more detail later. fT modelling in particular is directly affected by qs, and in the case of the KSC1845, so much so that it's impossible to get an fT curve that peaks where it should. For that reason I've also created a model without qs, which could be useful in cases where bandwidth, phase margin, etc. are more important than qs.
- It's frustrating that datasheets rarely (if ever) give any useful info about reverse characteristics, but I always assumed those parameters wouldn't matter much in the usual circuits. Then one day I modified by accident ISC in one of my models and the forward curves, the qs region in particular, changed quite a bit. I came up with a little trick to make the DCA Pro plot reverse curves, so I've had a go at tweaking those parameters too.
- Where neither the datasheet nor my measurements gave me useful info to adjust some parameter, I either left it at its stock or default value, followed Bob's very useful rules of thumb or just made an educated (I hope) guess. I realize that some things require building a specific measurement rig (the DCA Pro has its limitations) but I wanted to see how far I could get with what I have.
So, without further ado:
.model KSC1845 NPN (
+IS = 52.5f NF = 1.0 BF = 408 VAF = 150
+ISE = 4f NE = 1.5 IKF = 0.8
+RC = 0.28 RE = 0.15 RB = 40 RBM = 4.0 IRB = 250u
+ISC = 1.9p NR = 1.0 BR = 15 VAR = 20 NC = 1.3
+CJC = 4.8p VJC = 0.6 MJC = 0.29 TF = 149p VTF = 4.0
+CJE = 26.5p VJE = 0.73 MJE = 0.162
+RCO = 105 VO = 2.2 GAMMA = 1.6u QCO = 2p QUASIMOD = 1
+EG = 1.181 TR = 10n XTB = 1.728 )
.model KSC1845NQ ako:KSC1845 (
+RCO = 0.0 IKF = 0.39
+CJE = 31p TF = 418p ITF = 68m XTF = 18.7 )
.model KSA992 PNP (
+IS = 48.3f NF = 1.0 BF = 395 VAF = 65
+ISE = 0.5f NE = 1.5 IKF = 0.25
+RC = 48m RE = 4.4m RB = 25 RBM = 2.5 IRB = 3.8m
+ISC = 1.8p NR = 1.0 BR = 5.9 VAR = 12 NC = 1.3
+CJC = 7p VJC = 0.6 MJC = 0.32 TF = 365p VTF = 4.0
+CJE = 25p VJE = 0.855 MJE = 0.4404 ITF = 0.75 XTF = 1.13k
+RCO = 55 VO = 3.0 GAMMA = 490n QCO = 300f QUASIMOD = 1
+EG = 1.16 TR = 10n XTB = 1.285 )
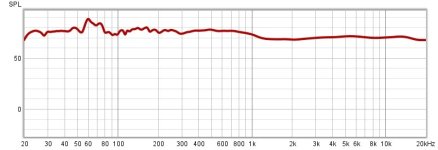
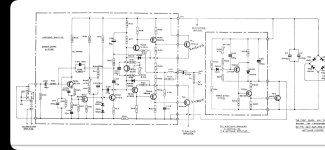
KSC1845NQ is the one without quasi saturation. See attached simulated (top) and measured (bottom) Ic vs Vce curves. More to come...
(*)
https://www.onsemi.com/pub/Collateral/KSC1845.lib
https://www.onsemi.com/pub/Collateral/KSA992.lib