Reading tea leaves is a good first step 🙂. . That's why I try to minimise the processing as much as I can. Can you solve something another 9more physical) way? Go with that!
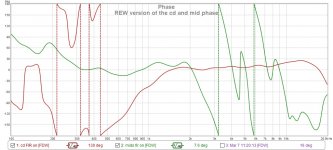
The result you had one page ago, with the CD back to previous polarity was close. Did you try my REW trick, filtering the frequencies close to the crossover with 1/3 octave filters? Don't align IR's, align the wave front.
That is essentially why I went with CD INV in the first place - it needed a smaller hammer. Perhaps even the smaller hammer - paragraphic phase EQ was too big. Maybe the first order all pass that BYRTT suggested in conjunction with your REW trick will be just the gentle nudge it needs.
But I also have a HornResp sim of the multiple entry horn that I could try to correlate. The MEH feature of HR was implemented after the design was mostly done so I haven't spent a lot of time with it. If I work on it a little more, it might give me some insight into what to expect.
Thanks!
+ delays imposed by DSP processing?
//
... In our real world we need to measure as we don't know the exact position of the acoustic centres.
+ delays imposed by DSP processing?
//
Yesterday I was trying to use @CharlieLaub's two driver phase tracking extension to ACD, his crossover program. I got divide by zero error's with the data for the CD true case that I was looking at then. That was a data dependent error. This morning looking at CD INV again it worked and showed me relative phase angles.
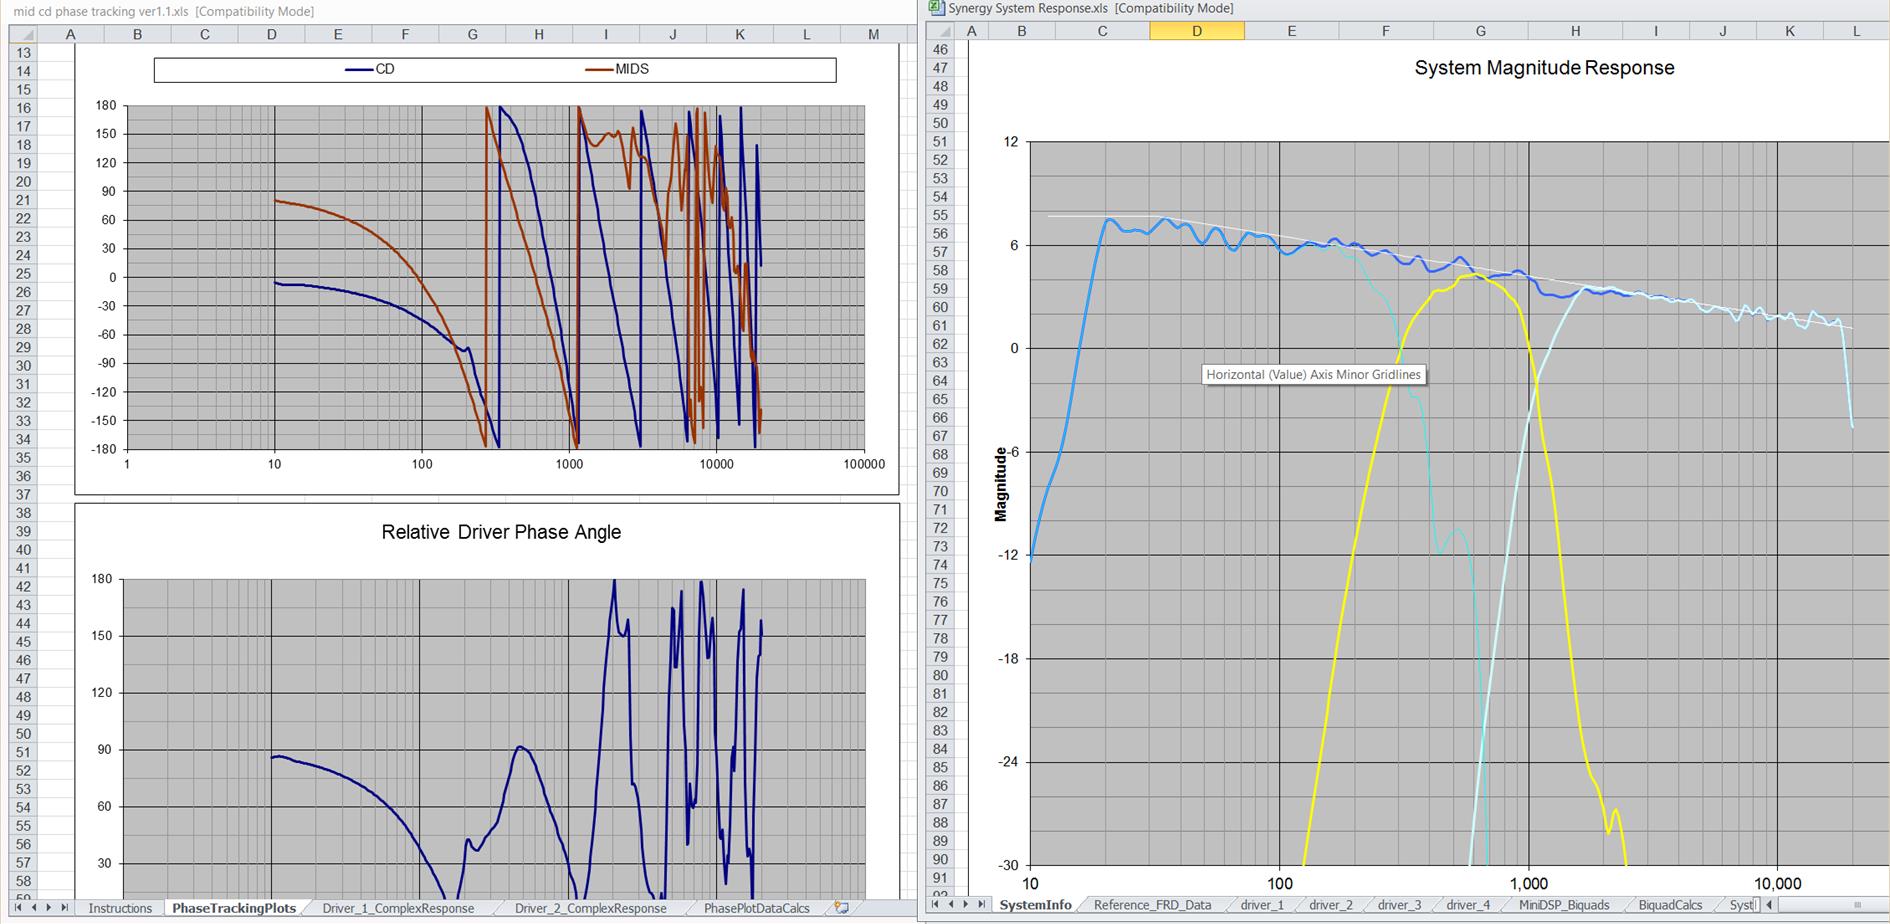
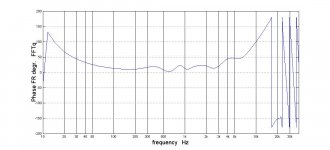
As you can see, I've got zero degree phase error only at the XO frequency.
As you can see, I've got zero degree phase error only at the XO frequency.
Attachments
I'm trying my hand at reference creation in Rephase and summation via trace arithmetic in REW with both minimum phase and linear phase filters. I see that I get flat summation only with linear phase filters. Ostensibly, linearizing the minimum phase filters implemented in the miniDSP in the OpenDRC results in the same flat summation.
However, what I see summing minimum phase filters in REW is that in phase summation results in a 16 db dip at XO while out of phase summation is nearly flat. This is reversed when the IIR filters are linearized. That is exactly the problem/confusion we have been seeing!
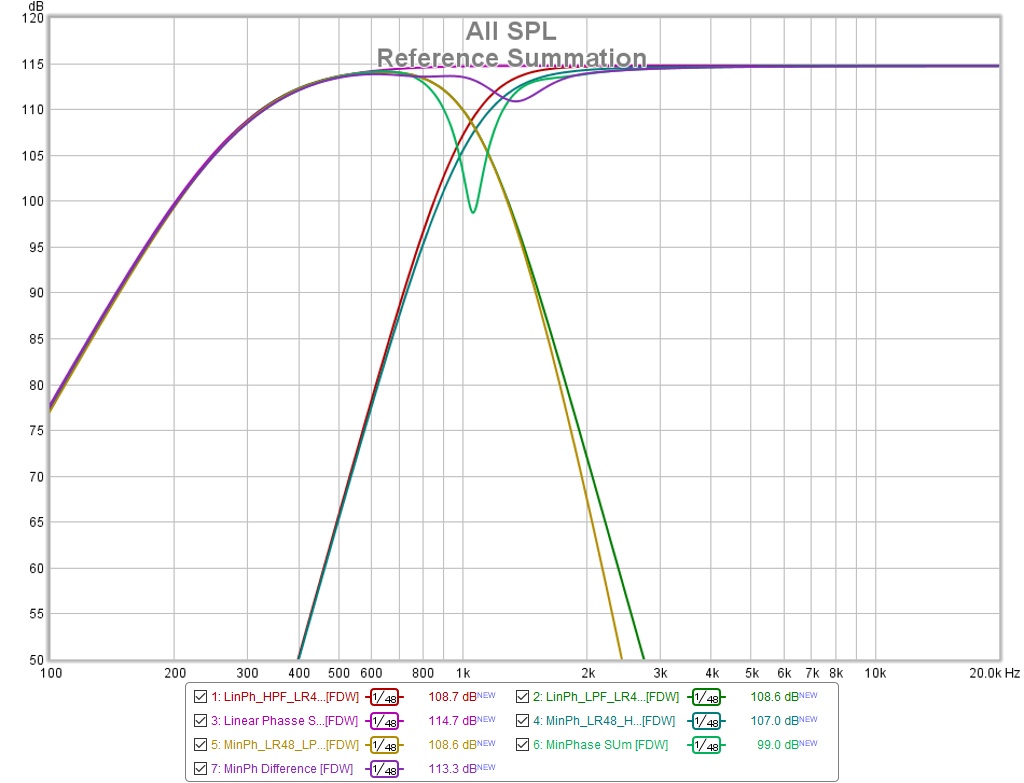
If that is true, what I have setup in ACD is the out of phase sum with minimum phase filters but the relative phase angles are nothing like what the REW reference sum predicts.
However, what I see summing minimum phase filters in REW is that in phase summation results in a 16 db dip at XO while out of phase summation is nearly flat. This is reversed when the IIR filters are linearized. That is exactly the problem/confusion we have been seeing!
If that is true, what I have setup in ACD is the out of phase sum with minimum phase filters but the relative phase angles are nothing like what the REW reference sum predicts.
Attachments
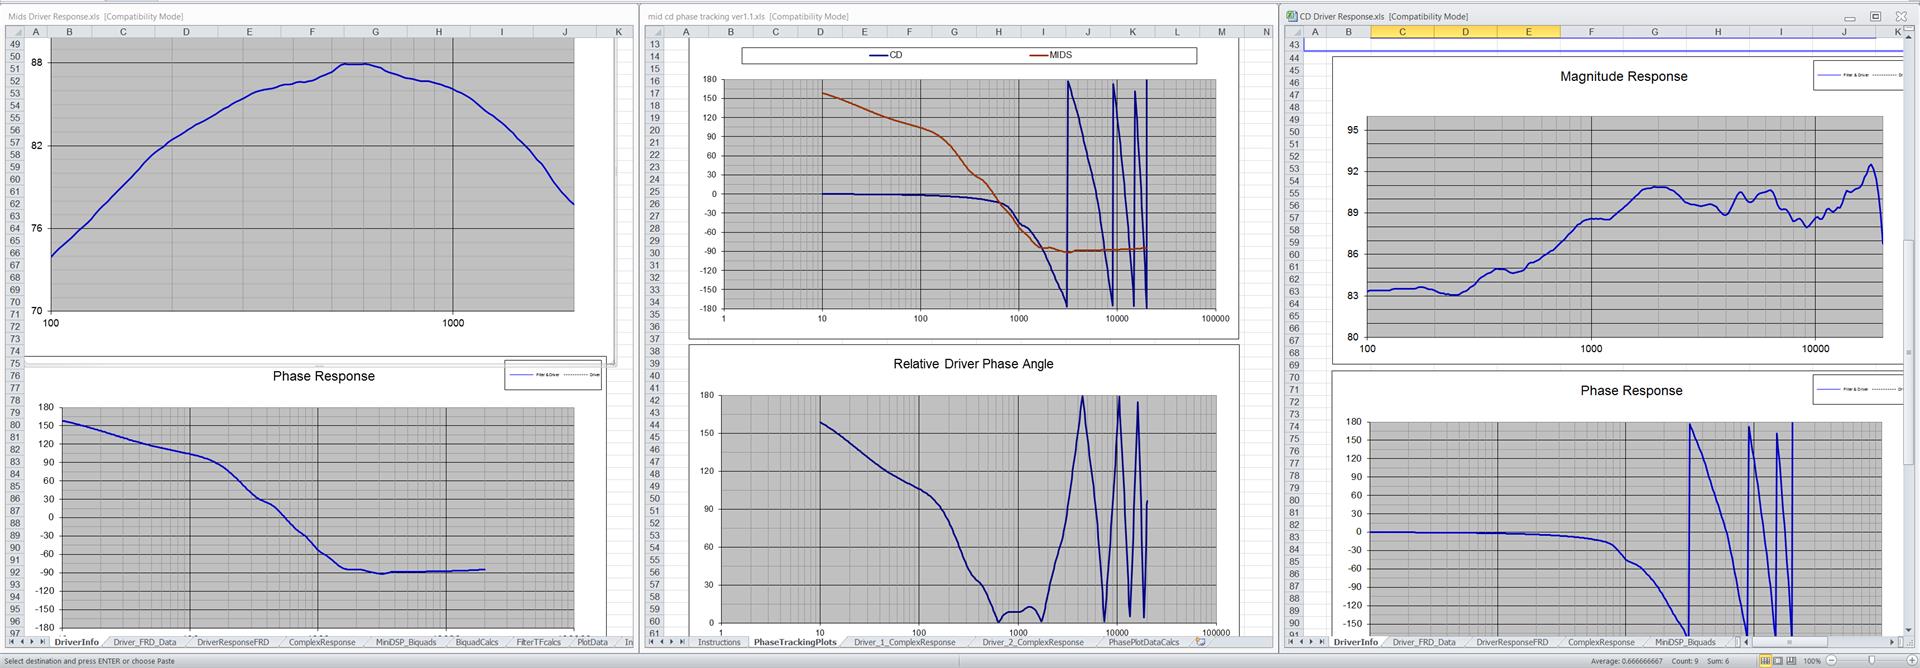
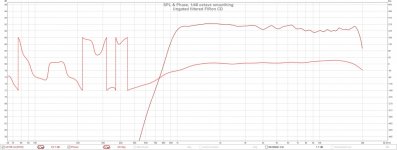
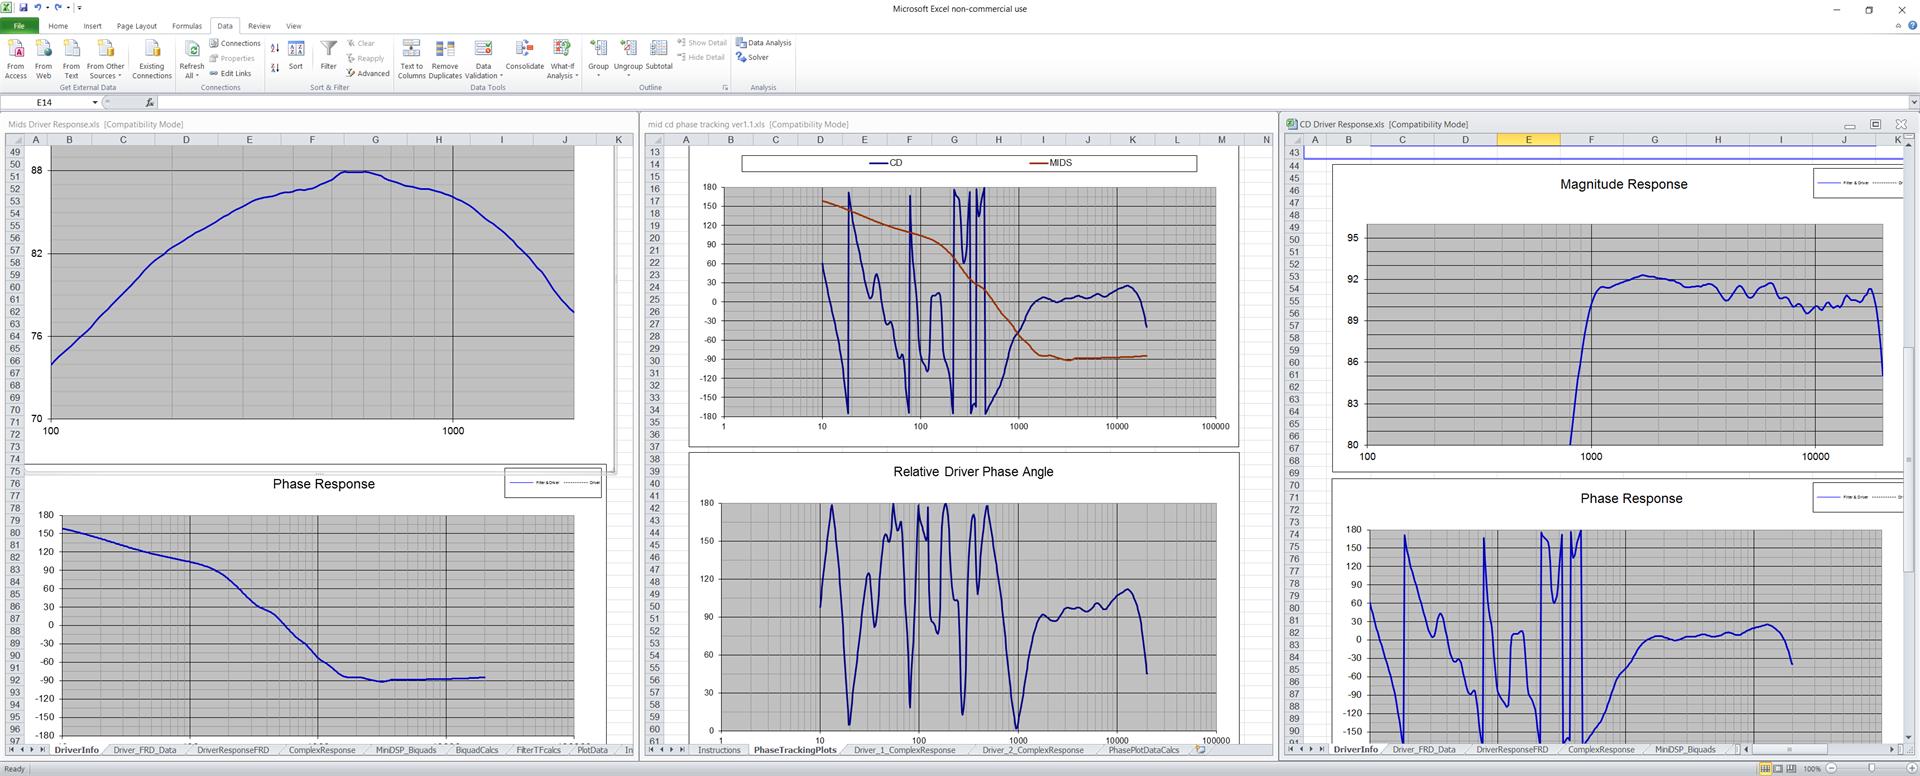
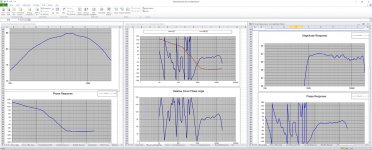
Next I measured the filtered driver with filter linearization and phase correcting FIR on and entered the 10 ms gated and fdW5 responses in ACD with phase tracking. Mid is on the left, CD is on the right, phase tracking in the middle
Attachments
That gated CD measurement is problematic. When you set a time gate, you need to set the window reference time to the IR peak. For this measurement of the CD, the IR peak is narrower than the time resolution of .1 ms, so I can only get close to the peak and that affects the response. I needed to gate the mid measurement to exclude LF noise. I don't need to do that for the CD
This is a very different picture of the phase at XO but still has the multiple phase wraps higher up. These don't appear in the measurement
This is a very different picture of the phase at XO but still has the multiple phase wraps higher up. These don't appear in the measurement
Attachments
Last edited:
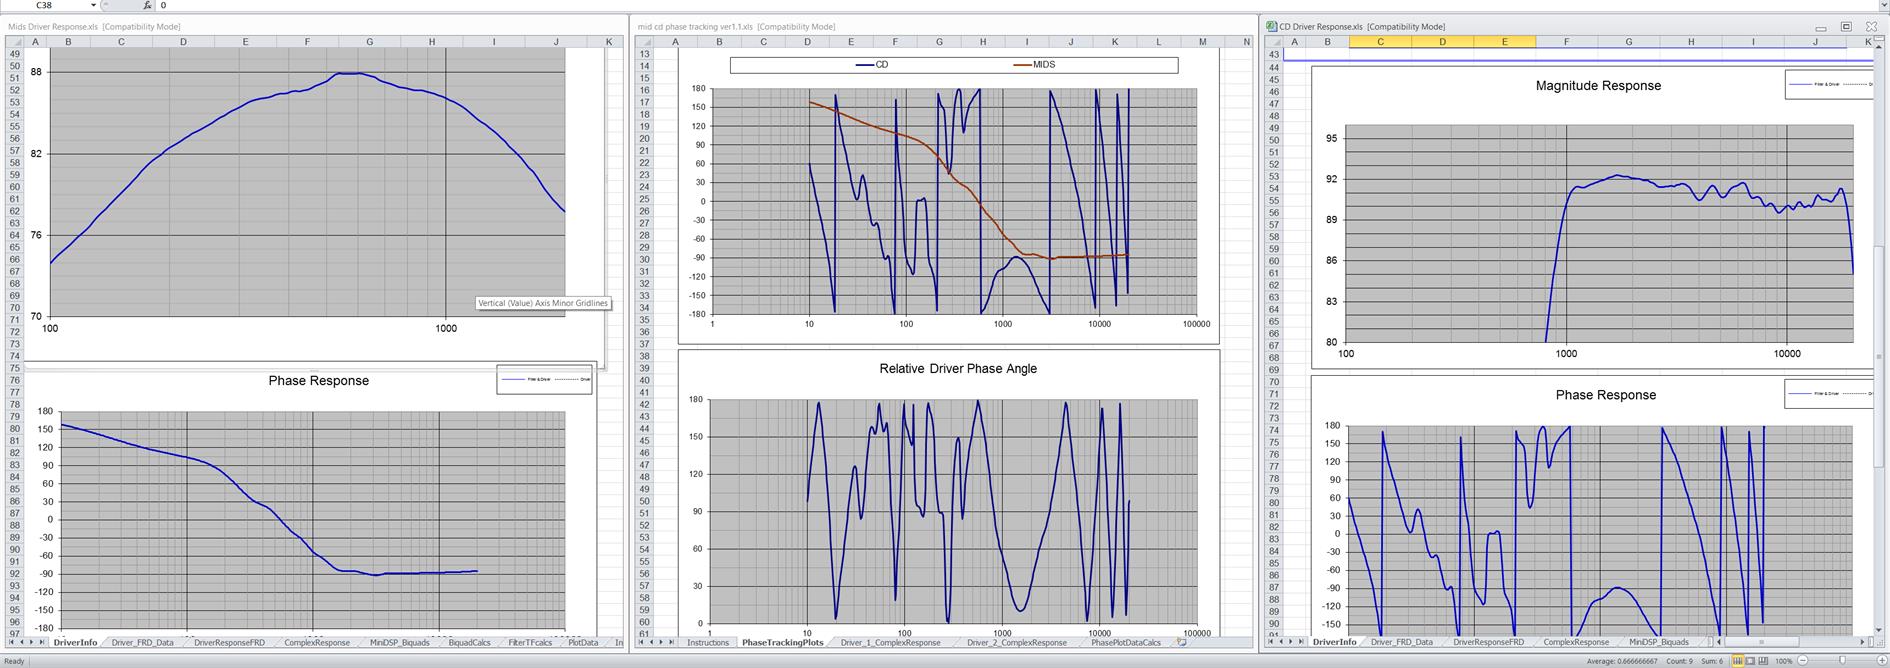
Explanation for the multiple phase wraps in the CD is that I hadn't yet removed the physical offset time delay for the CD from the XO program. Removing that produces this picture:
The multiple phase wraps in the high end of the CD are gone. Those below XO don't matter; the response is well down there. I couldn't gate them out without distorting the response because of inability to set the window reference time to the IR peak.
Now if the center of the above picture matched what REW shows me about the phase of the CD and mid, we'd be done.
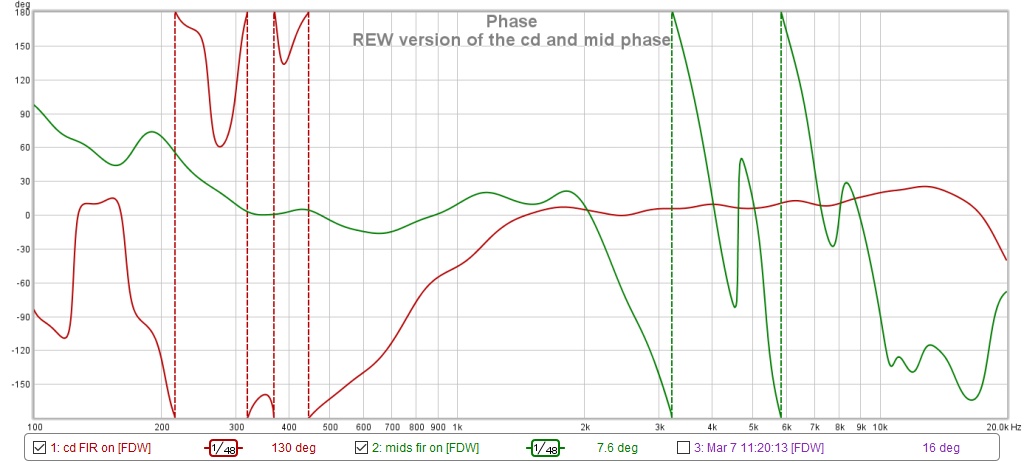
But it doesn't, so this adventure may continue. If I can get ACD to agree with REW, then I can play with all pass filters in ACD to get a better phase match at XO
The multiple phase wraps in the high end of the CD are gone. Those below XO don't matter; the response is well down there. I couldn't gate them out without distorting the response because of inability to set the window reference time to the IR peak.
Now if the center of the above picture matched what REW shows me about the phase of the CD and mid, we'd be done.
But it doesn't, so this adventure may continue. If I can get ACD to agree with REW, then I can play with all pass filters in ACD to get a better phase match at XO
Attachments
I'm trying my hand at reference creation in Rephase and summation via trace arithmetic in REW with both minimum phase and linear phase filters. I see that I get flat summation only with linear phase filters. Ostensibly, linearizing the minimum phase filters implemented in the miniDSP in the OpenDRC results in the same flat summation.
However, what I see summing minimum phase filters in REW is that in phase summation results in a 16 db dip at XO while out of phase summation is nearly flat. This is reversed when the IIR filters are linearized. That is exactly the problem/confusion we have been seeing!
If that is true, what I have setup in ACD is the out of phase sum with minimum phase filters but the relative phase angles are nothing like what the REW reference sum predicts.
You can get a perfect sum for the minimum phase example, as long as you line up the driver's output at the crossover with the right time delay (easily set in the IR tab).
I see lots of graphs fly by, yet the most important part would be to line up the drivers at the crossover in phase and therefore letting them sum properly. At least that would be the point for such an exercise which is why I recommended this way. Virtually playing with this is a lot easier than measuring your way there. You don't need linearized phase to get the sum. In fact, you need to set the proper delay without any linearization and then apply that linearization as a last step. That will make the APL plot as pretty as the one I showed. And with the Synergy it should work over its coverage area.
Last edited:
Fascinating subject and development. Almost thriller like 🙂
But what is a tentatively structured order of steps in the tuning process?
Is there such a description?
//
But what is a tentatively structured order of steps in the tuning process?
Is there such a description?
//
setting time delays in the IR tab was the piece I was missing. I've got the IR tab open but I still don't see how to do it. Adjusting "t = 0 offset" moves the time at which an IR appears in the IR tab but doesn't seem to change the relative alignment in overlay IRs or affect a new A+B
Tentative I can do:Fascinating subject and development. Almost thriller like 🙂
But what is a tentatively structured order of steps in the tuning process?
Is there such a description?
//
1. Create/define your filters
2. Measure each driver with its filters enabled
3. Adjust DSP delays for alignment
a. If IIR filters align at "start" of IR, which is fuzzy if any pre-ringing & at LF
b. If linear phase filters or if IIR filters linearized, align peaks of IR, which is unambigous
4. Remeasure drivers to verify alignment
5. Measure all drivers at once to see XO performance
XO looked good but HF phase needed correction. So I added a paragraphic phase EQ. Need to be careful with this as it may affect driver time alignment
Many thanks!
0. IIR linearize drivers 1 octave outside passband before adding filters?
//
0. IIR linearize drivers 1 octave outside passband before adding filters?
//
Last edited:
Many thanks!
0. IIR linearize drivers 1 octave outside passband before adding filters?
//
That isn't what I meant. I thought you had the context.
In terms of implementing your filters:
1. Get a target reference curve for each driver's XO filter. E.g. An LR48 Low pass filter used for my mids
2. Using PEQs in the DSP, equalize the mid measurement to fall onto that curve; at least in magnitude but also in phase
3. Repeat above for all drivers.
So the old rule of using EQ to flatten a driver for a couple of octaves past XO and then apply the LPF or HPF should be thrown away and replaced by the above. Its works better and is easier to do when the driver's output falls off so quickly you can't flatten for those one or two octaves.
In the MiniDSP 4x10 I used, these would be IIR filters. I'm cascading that device with an OpenDRC-DI to do FIR. Rephase can generate correction filters for textbook XO filters such as LRx or BUTx. So by linearize, I meant use Rephase generated FIR in OpenDRC to flatten the phase of my IIR XO filters.
If you are using something like the new(er) MiniDSP 2x4HD, you can implement linear phase XO filters directly.
OK!
1. Get a target reference curve for each driver's XO filter. E.g. an LR48
2. Using PEQs in the DSP, equalize the mid measurement to fall onto that curve; at least in magnitude but also in phase
3. Repeat above for all drivers.
4. Adjust DSP delays for alignment
a. If IIR filters align at "start" of IR, which is fuzzy if any pre-ringing & at LF
b. If linear phase filters or if IIR filters linearized, align peaks of IR, which is unambigous
5. Remeasure drivers to verify alignment
6. Measure all drivers at once to see XO performance
?
//
Last edited:
setting time delays in the IR tab was the piece I was missing. I've got the IR tab open but I still don't see how to do it. Adjusting "t = 0 offset" moves the time at which an IR appears in the IR tab but doesn't seem to change the relative alignment in overlay IRs or affect a new A+B
It will for me,
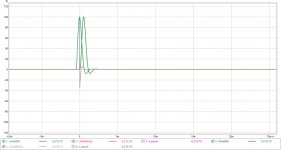
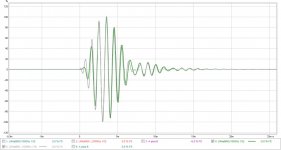
Here's that LR4 sample again:
First two drivers mentioned in the legend are with IR peak aligned in REW to T=0. It's responsible for that dip in the first (A plus B) summed graph.
On the second set I only delayed the low passed "mid" signal by 0.050 ms. This results in the new sum (second A plus B graph) being flat.
The IR's in the Overlay graphs:
Clear to see one of the low passed driver's IR has moved in time. The tweeters are both still at T=0.
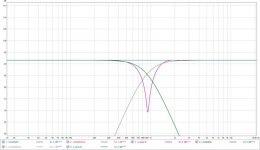
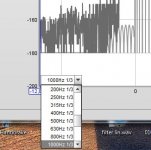
Now I move on to set the 1/3 octave filters in the filtered IR tab for all drivers to 1000 Hz and we look how they sum. So go to the filtered IR tab, in bottom left corner set the filter you want:
First we look at the drivers without any delay applied to them:
See how the separate wave shapes (one low passed and one high passed) don't line up? This is what's causing the dip in the first (a plus B) sum.
The drivers are both aligned with the IR at exactly T=0, but the actual crossover frequency isn't aligned, and that's where it matters only!
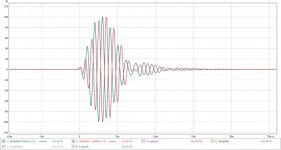
Now lets look at the set of drivers with the low passed driver delayed by 0.050ms:
Now they do line up at the crossover and create that second flat FR (A plus B) sum measurement.
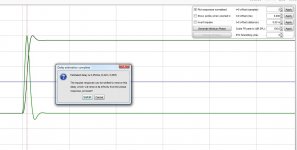
To prove the timing on that delayed driver (the mid in our case here) I let REW estimate the delay:
See how it confirms the delay of 0.050 ms? That little delay is making it sum at the crossover frequency. It's the reason the wave shapes line up there.
Attachments
Last edited:
@Wesayso: I forget what version of my xo I posted a WAV for. Let me post one for my CD INV xo in its current state. I would like to see what you can do with my current .WAV to see if there is something fundamentally wrong with it.
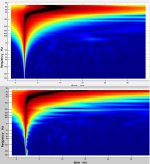
Let me also post the TDA of your correction and mine together for comparison and perhaps discuss where the differences come from. As you mentioned, some are from different/better windowing strategies. Others might be due to the fact that you have essentially unlimited FIR taps available. You also have auto-eq, I suspect, which means you don't have to manipulate sliders endlessly to get a smooth curve.
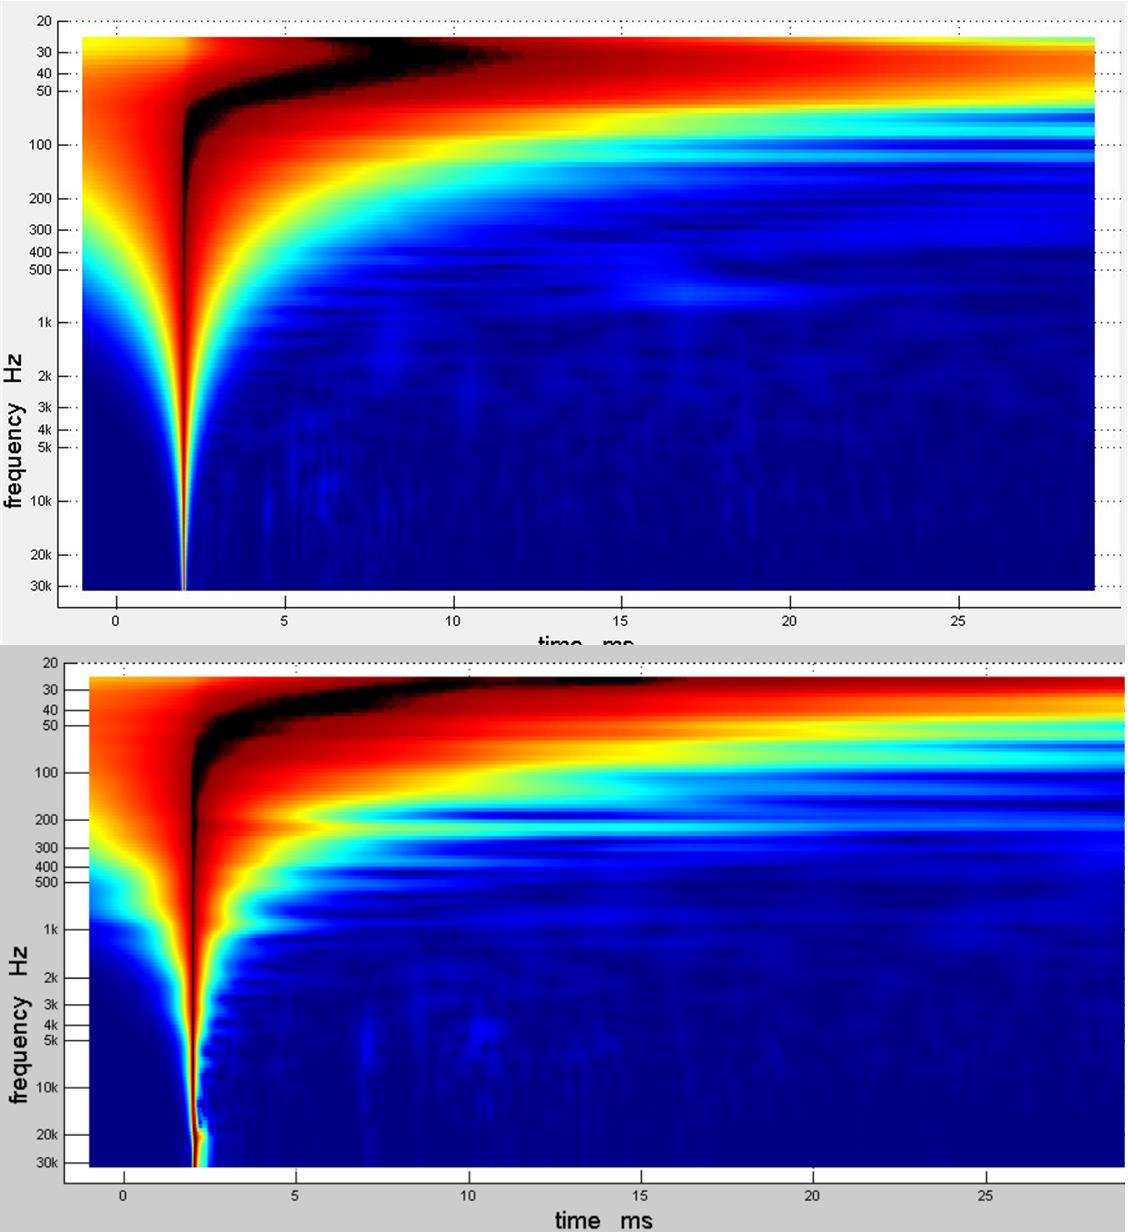
One clear difference between the two pictures are the smooth vs ragged edges at color boundaries. What is that indicative of? Small phase variations?
I would believe that, since this is what TDA shows me for the PFR with min phase subtracted

Let me also post the TDA of your correction and mine together for comparison and perhaps discuss where the differences come from. As you mentioned, some are from different/better windowing strategies. Others might be due to the fact that you have essentially unlimited FIR taps available. You also have auto-eq, I suspect, which means you don't have to manipulate sliders endlessly to get a smooth curve.
One clear difference between the two pictures are the smooth vs ragged edges at color boundaries. What is that indicative of? Small phase variations?
I would believe that, since this is what TDA shows me for the PFR with min phase subtracted
Attachments
Next step would be fine tune or perhaps repeat loop until satisfied. Somewhere in there you need to listen and also check linearity.OK!
1. Get a target reference curve for each driver's XO filter. E.g. an LR48
2. Using PEQs in the DSP, equalize the mid measurement to fall onto that curve; at least in magnitude but also in phase
3. Repeat above for all drivers.
4. Adjust DSP delays for alignment
a. If IIR filters align at "start" of IR, which is fuzzy if any pre-ringing & at LF
b. If linear phase filters or if IIR filters linearized, align peaks of IR, which is unambigous
5. Remeasure drivers to verify alignment
6. Measure all drivers at once to see XO performance
?
//
You certainly want to look at the step response of the full crossover to verify time alignment.
re'
So to be more specific about step 2; + "see to that he slopes adopt the desired acoustical steepness and "linearity." ?
I can't find the post where you asked this other than in my email alert. Did I really say it that badly?
I had in mind that you would have a REW or crossover program graph showing both the measurement and the target reference curve together and you would equalize so that the curves were on top of each other. Its usually easy to get the magnitude curves to align but as a finer alignment step you should also get the phase curves to align. You could use REW overlay for this.
- Home
- Loudspeakers
- Multi-Way
- My Synergy Corner Horn and Bass Bins