Jack is back, as some of my friends began saying after the Terminator movie came out.
I'm going back into the XO program to straighten the treble FR and then use RePhase to correct the phase near the XO.
BTW when I shifted the IR, the minimum phase curve flattened right out. Maybe Rephase can handle the correction of the HF to the house curve now. But I should get it closer in IIR, I was having trouble getting the shelf filter to correct the constant directivity rolloff right and figured what I had was close enough given that FIR was coming.
In retrospect, the difficulty has been finding the right time alignment. The breakthrough was realizing that correct alignment is with IR peaks aligned after FIR linearization of the XO filters. I wish I understood why that is true. In any case, I'm going to back and see what alignment I have pre-FIR. That will be useful to know.
MY IRs have shown ringing since day one. Its been passed off as one thing or another but we've never really focused on it as there have been higher priorities. Its good to know that at least some of it is cleared up by EQ. I have been concerned that it might be due to the unterminated horn mouth or throat imperfections.
I will get to horizontal polars but I don't want to move my mic until we have cleared up its single point in space.
Please only change one thing at a time and see what that does. It will increase the lesson learned and prevent mistakes.
The answer to your question about the correct alignment is right here in this thread. 🙂
I think you are right with the throat and mouth being part of the rough start of the IR. Hopefully it will be similar off axis or else EQ can't fix all of it.
The answer to your question about the correct alignment is right here in this thread. 🙂
I think you are right with the throat and mouth being part of the rough start of the IR. Hopefully it will be similar off axis or else EQ can't fix all of it.
something to show after changing several things one thing at a time and recording all my steps.
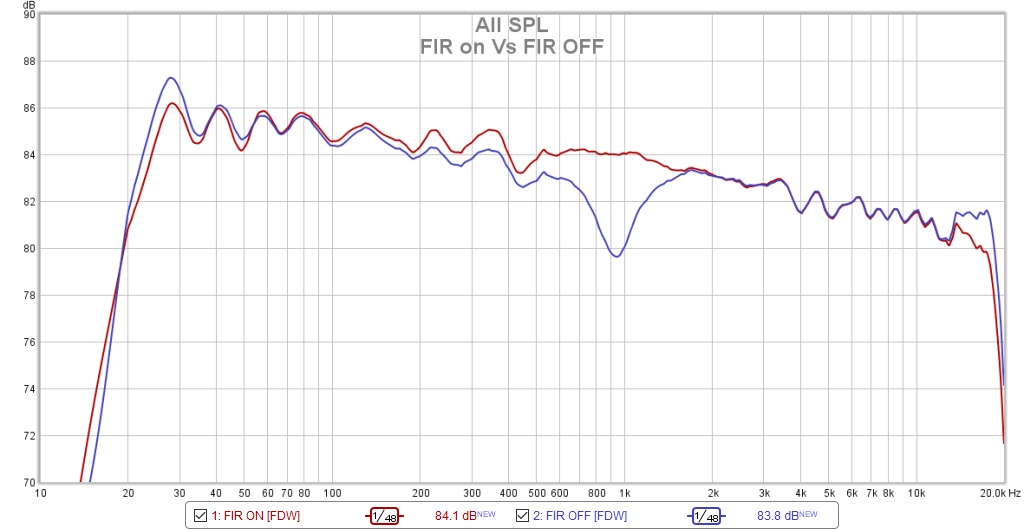
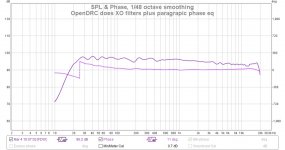
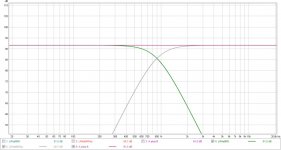
First thing I saw was the HF didn't match the xo software prediction. I re-eqed it, then compared FIR on to FIR off. The FIR is doing some additional attenuation at the high end and a little boost at the low end. The dip in the middle is the reason why we've had so much difficulty finding time alignment.
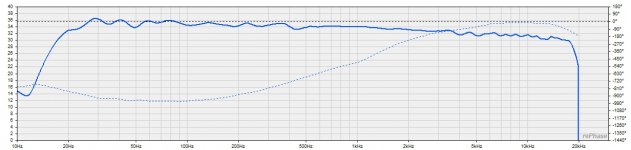
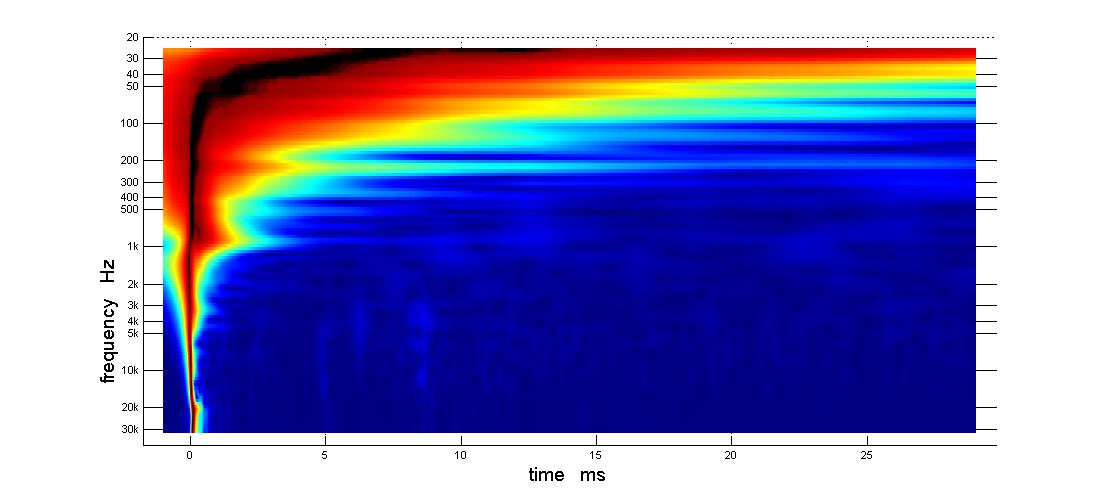
here is what the phase looks like in REW

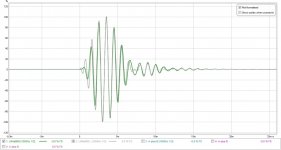
You can see that I've shifted the IR to zero to remove the excess phase.
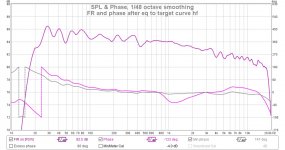
Here is what the FR and phase look like imported into RePhase

It looks like the excess phase is still there. How do I get rid of it?
First thing I saw was the HF didn't match the xo software prediction. I re-eqed it, then compared FIR on to FIR off. The FIR is doing some additional attenuation at the high end and a little boost at the low end. The dip in the middle is the reason why we've had so much difficulty finding time alignment.
here is what the phase looks like in REW
You can see that I've shifted the IR to zero to remove the excess phase.
Here is what the FR and phase look like imported into RePhase
It looks like the excess phase is still there. How do I get rid of it?
Attachments

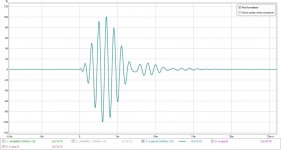
Based on your wave file from earlier I made an frd file to import in RePhase:

So I'm not seeing what you are...
Set the impulse peak at zero in REW from the measurement you want to export. Export the IR as 32 bit mono wave file and re-import into REW.
Check if the impulse is still at zero. Export the IR you just imported as a measurement in frd format and import in RePhase.
That's my suggestion. I couldn't find how to export the FDW version though, even though I told REW to apply IR filters it still saved the entire unfiltered IR. I'd want to have the 6 cycle FDW version in RePhase or I would be equalizing the room instead of the speaker. I know of a way to do it, but that would involve using DRC-FIR to do the frequency dependent windowing. I'd even prefer that option as DRC-FIR is showing way more detail than REW's version of frequency dependent windowing.
Attachments
Last edited:
Set the impulse peak at zero in REW from the measurement you want to export. Export the IR as 32 bit mono wave file and re-import into REW.
Check if the impulse is still at zero. Export the IR you just imported as a measurement in frd format and import in RePhase.
thanks. that worked the 2nd time I tried it - after restarting Rephase
but I see the problem. I can't do the filter linearization at the same time. as soon as I specify the filter linearization, that shows up in the phase window on top of the measurement phase. So I think what I need to do is import the measurement, correct its phase, and only then add the filter linearization.
so I have to import the measurement of the linearized XO into Rephase before I specify the XO linearization filters, correct the phase in the measurement, then specify the xo filters, then generate one FIR filter to correct both the phase and the xo filters.
Thanks,Brytt and Wesayso, for your help and patience
I can get that LF smoother but that is the room making it bumpy so I will move on to the LP.
Attachments

It could be worthwhile to look at off axis at this point to see what the IR looks like there.
Solving those early wiggles in the IR will make imaging more clear.
If you can find what's causing it and solve that, even better!
I'd still recommend following the generated minimum phase curve.
I bet the APL_TDA plot will look pretty straight by now.
Solving those early wiggles in the IR will make imaging more clear.
If you can find what's causing it and solve that, even better!
I'd still recommend following the generated minimum phase curve.
I bet the APL_TDA plot will look pretty straight by now.

The first plot in #463 and the APL_TDA plots indicate the crossover slopes of the mid/CD don't sum as they should/could. Do you see the problem still being there after FIR correction?
This means the phase of the CD and mid does not line up as it should. In the miniDSP, do you have named crossovers set? While using PEQ to make sure they follow the expected slope?
Right now the top part of the slope works, crossover is at 1050 right?
You asked the question how the IR's should line up. My answer would still be: they should line up at the crossover in the case of a Linkwitz Riley crossover. Meaning the phase at and slightly above and below the crossover should align.
This TDA plot makes me think you were better off without the CD inverted and dealing with that twist in the CD phase with RePhase of this plot:
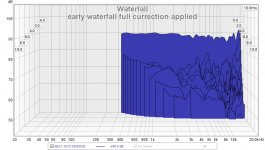
That's the one I used for my processing in post #456. That one will not show a dent at the crossover frequency as is apparent in the early waterfall.
Generate an early waterfall for your current settings and it will be obvious things don't line up right now.
Use these numbers:

If you ask me, the reason for the deviation is the CD when placed in a horn, making the top end drop which causes a close to one order difference once you EQ it back into shape. I guess that's what BYRTT was getting at. The twist in phase in the CD. Plus the output of the mid is probably boosted on its band pass top end to make it reach that high?
It would really help to see the separate drivers FR plus Phase. This is like shooting in the dark for us. You're close to the finish and we can get there. The goal remains to match/overlap phase at the crossover frequency.
I still don't know why we moved to LR8 as LR4 should work as well.
This means the phase of the CD and mid does not line up as it should. In the miniDSP, do you have named crossovers set? While using PEQ to make sure they follow the expected slope?
Right now the top part of the slope works, crossover is at 1050 right?
You asked the question how the IR's should line up. My answer would still be: they should line up at the crossover in the case of a Linkwitz Riley crossover. Meaning the phase at and slightly above and below the crossover should align.
This TDA plot makes me think you were better off without the CD inverted and dealing with that twist in the CD phase with RePhase of this plot:
That's the one I used for my processing in post #456. That one will not show a dent at the crossover frequency as is apparent in the early waterfall.
Generate an early waterfall for your current settings and it will be obvious things don't line up right now.
Use these numbers:
If you ask me, the reason for the deviation is the CD when placed in a horn, making the top end drop which causes a close to one order difference once you EQ it back into shape. I guess that's what BYRTT was getting at. The twist in phase in the CD. Plus the output of the mid is probably boosted on its band pass top end to make it reach that high?
It would really help to see the separate drivers FR plus Phase. This is like shooting in the dark for us. You're close to the finish and we can get there. The goal remains to match/overlap phase at the crossover frequency.
I still don't know why we moved to LR8 as LR4 should work as well.
Last edited:
Try it theoretically to make yourself familiar with what happens at the crossover.
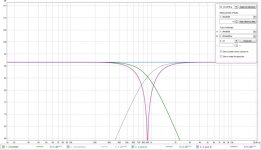
An example I used before in this thread, a theoretical LR4 at 900 Hz.
You know the graph of that LR4 crossover:

Just the textbook slopes and their sum.
If we look at phase of each separate slope we get this (after time alignment)

See how the phase lines up at, above and below the crossover?
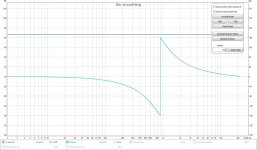
The sum will have a phase curve like this:

This phase can be rolled back with FIR correction. But to get here I had to align the phase at the crossover frequency. I didn't align it using the IR's I looked at phase specifically.
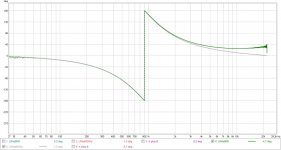
If I invert one of the drivers (the tweeter for example) and do another sum I get the deepest dip possible between the two drivers at the crossover:

That's how we can check the crossover is at the right spot with the right slopes and alignment.
Now I said we need to align the wave shape at the crossover a few pages back. Lets look at what happens slightly above the crossover, both drivers will sum there to form our wave shape.
Looking at each part separately we see both drivers still line up there (using overlays window in REW):

See how both drivers add up to form the sine wave at 1000 Hz? Here we see them both add their part.
To view this I chose a 1/3 octave filter for each separate driver at 1000 Hz (just above my crossover at 900 Hz) and looked at the IR's in the Overlays window in REW.
If we look at it in the summed LR4 filtered at 1000 Hz (also filtered 1/3 octave at 1000 Hz) it looks like this:

In your last example, the output below the crossover does not sum properly, so it's save to say the alignment doesn't follow the LR rules.
If we get the separate parts within 1/4 wavelength of each other they will still sum. As your example does above 1050 Hz. But once you get past that quarter wave distance between each driver's wave shape it will create a shallow dip, like the one in post #463.
If you force that back into shape, it will create that wobble with extra energy at one side and missing on the opposite side, like we see in the APL_TDA plot just below the crossover frequency:
Perfectly corresponding in frequency placement to the dip in the FR plot without the FIR correction applied.
So timing is important, as are the slopes to get it perfect. Align at the crossover frequency, I showed you a trick you can use to verify (using REW's overlay graphs looking at the IR tab there, after first setting 1/3 octave filters in the filtered IR tab for each separate driver. Use a frequency just above or below or at the crossover frequency you use.
An example I used before in this thread, a theoretical LR4 at 900 Hz.
You know the graph of that LR4 crossover:
Just the textbook slopes and their sum.
If we look at phase of each separate slope we get this (after time alignment)
See how the phase lines up at, above and below the crossover?
The sum will have a phase curve like this:
This phase can be rolled back with FIR correction. But to get here I had to align the phase at the crossover frequency. I didn't align it using the IR's I looked at phase specifically.
If I invert one of the drivers (the tweeter for example) and do another sum I get the deepest dip possible between the two drivers at the crossover:
That's how we can check the crossover is at the right spot with the right slopes and alignment.
Now I said we need to align the wave shape at the crossover a few pages back. Lets look at what happens slightly above the crossover, both drivers will sum there to form our wave shape.
Looking at each part separately we see both drivers still line up there (using overlays window in REW):
See how both drivers add up to form the sine wave at 1000 Hz? Here we see them both add their part.
To view this I chose a 1/3 octave filter for each separate driver at 1000 Hz (just above my crossover at 900 Hz) and looked at the IR's in the Overlays window in REW.
If we look at it in the summed LR4 filtered at 1000 Hz (also filtered 1/3 octave at 1000 Hz) it looks like this:
In your last example, the output below the crossover does not sum properly, so it's save to say the alignment doesn't follow the LR rules.
If we get the separate parts within 1/4 wavelength of each other they will still sum. As your example does above 1050 Hz. But once you get past that quarter wave distance between each driver's wave shape it will create a shallow dip, like the one in post #463.
If you force that back into shape, it will create that wobble with extra energy at one side and missing on the opposite side, like we see in the APL_TDA plot just below the crossover frequency:
Perfectly corresponding in frequency placement to the dip in the FR plot without the FIR correction applied.
So timing is important, as are the slopes to get it perfect. Align at the crossover frequency, I showed you a trick you can use to verify (using REW's overlay graphs looking at the IR tab there, after first setting 1/3 octave filters in the filtered IR tab for each separate driver. Use a frequency just above or below or at the crossover frequency you use.
Attachments
Last edited:
Well, I kind of hoped that I'd get to listen to enjoy this configuration for a couple of days before the other shoe dropped but I knew something would be coming as soon as I saw the TDA phase plot. Its hard to imagine the sound being better.
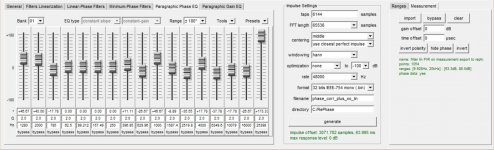
I recall when doing the final phase correction at/around 1 KHz, I needed to set the sliders to +/- 180 degrees to be able to do the correction. I think this is the correction and if you can read the fine print, the slider at 1000 hz is correcting 46 degrees. The 3 leftmost sliders are also correcting this region.

So that is the counterpoint. If that is all the phase change it took to get flat phase and a good step, then the CD must have the correct polarity. I still have more of my AM ritual to get through before I can go through your post point by point. I came up here to look at Rephase expecting to find that I had used more than 90 degrees of correction
I recall when doing the final phase correction at/around 1 KHz, I needed to set the sliders to +/- 180 degrees to be able to do the correction. I think this is the correction and if you can read the fine print, the slider at 1000 hz is correcting 46 degrees. The 3 leftmost sliders are also correcting this region.
So that is the counterpoint. If that is all the phase change it took to get flat phase and a good step, then the CD must have the correct polarity. I still have more of my AM ritual to get through before I can go through your post point by point. I came up here to look at Rephase expecting to find that I had used more than 90 degrees of correction
Attachments
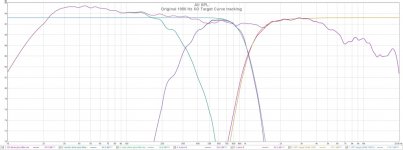
Here are the 1050 Hz driver target curves plotted against the drivers measured with filters in place. This is from the original 1050 Hz XO, with CD not inverted, which also had issues. The full range curve is a REW ((A+B) + C) computed sum of the three drivers. Edit: Actually its two separate overlapping (A+B)s

Attachments
Last edited:
re'
This phase can be rolled back with FIR correction. But to get here I had to align the phase at the crossover frequency. I didn't align it using the IR's I looked at phase specifically.
Is there a way to adjust time offset from one trace to another in REW when doing trace arithmetic?
This phase can be rolled back with FIR correction. But to get here I had to align the phase at the crossover frequency. I didn't align it using the IR's I looked at phase specifically.
Is there a way to adjust time offset from one trace to another in REW when doing trace arithmetic?
The first plot in #463 and the APL_TDA plots indicate the crossover slopes of the mid/CD don't sum as they should/could. Do you see the problem still being there after FIR correction?
This means the phase of the CD and mid does not line up as it should
Before I corrected it in Rephase, yes.
In the miniDSP, do you have named crossovers set?
Yes
While using PEQ to make sure they follow the expected slope?
Yes
Right now the top part of the slope works, crossover is at 1050 right?
Yes
This TDA plot makes me think you were better off without the CD inverted and dealing with that twist in the CD phase with RePhase of this plot:
You might think so until you look at the step response 🙂 Seriously, all the work of the last few days was trying to get a good step response.
That's the one I used for my processing in post #456. That one will not show a dent at the crossover frequency as is apparent in the early waterfall.
Generate an early waterfall for your current settings and it will be obvious things don't line up right now.
Use these numbers:
working on it but need to remeasure first
If you ask me, the reason for the deviation is the CD when placed in a horn, making the top end drop which causes a close to one order difference once you EQ it back into shape. I guess that's what BYRTT was getting at. The twist in phase in the CD. Plus the output of the mid is probably boosted on its band pass top end to make it reach that high?
edit: mid didn't need a boost. There was big peak circa 800 hz from horn gain and bandpass chamber that needed to be cut. Yes constant directivity horn needs +6db curve to flatten HF
It would really help to see the separate drivers FR plus Phase. This is like shooting in the dark for us. You're close to the finish and we can get there. The goal remains to match/overlap phase at the crossover frequency.
I just posted them...
I still don't know why we moved to LR8 as LR4 should work as well.
The compelling reason was noticing that the CD's raw response was LR24 and additional roll off was needed to protect it. Switching to LR48, eliminated the harshness I sometimes heard on loud passages
Last edited:
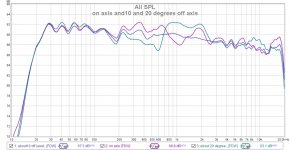
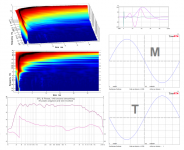
Off axis response
All the recent measurements have been with mic in line with my sweet spot, which is about 10 degrees off axis. Here are looks either side of that

Keep in mind its a simple conical horn, not a SEOS and that the scale is 2 db per division. It holds pattern down to 328 Hz without aid of the corner but does suffer waistbanding in the octave or two above that. This is a little worse than I expected. I had hoped to get within +/- one db of the center measurement when sitting on either side. Maybe I will get there with the 2ndry flare I have half finished down in the garage.
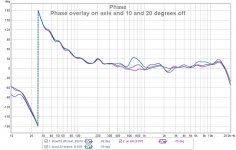
Here is the phase:

Its a point source from 300 Hz up so I expect the phase to behave. I don't know how this compares to other Synergies though. I'm actually surprised to see phase tracking through the woofer passband since it has a physical offset from the horn
All the recent measurements have been with mic in line with my sweet spot, which is about 10 degrees off axis. Here are looks either side of that
Keep in mind its a simple conical horn, not a SEOS and that the scale is 2 db per division. It holds pattern down to 328 Hz without aid of the corner but does suffer waistbanding in the octave or two above that. This is a little worse than I expected. I had hoped to get within +/- one db of the center measurement when sitting on either side. Maybe I will get there with the 2ndry flare I have half finished down in the garage.
Here is the phase:
Its a point source from 300 Hz up so I expect the phase to behave. I don't know how this compares to other Synergies though. I'm actually surprised to see phase tracking through the woofer passband since it has a physical offset from the horn
Attachments
At and around 8th order 1050Hz XO point is where we want't them to cooperate and while we can time step 1/2 a period out of phase at 1050Hz it would only work at that single frq number. When wired by the book drawback is tweeter non minimum phase lag up high show up in system phase but they in phase at XO point, and with reverse polarity system phase looks flatter but at XO point they interfer making that hole in wave build up seen in 3d TDA.
Polarity set as normal for this XO scheme:

Polarity reversed:

That said possible better solution could be repair phase selective for tweeter so it act like a real minimum phase device then this XO point at 1050Hz will begin work by the book.
On APL Audio site they spec APL1 unit as QUOTE 96kHz sampling rate and that the user can also use his own synthesized FIR filters in .wav format to supply to APL1s unit’s FIR engine UNQUOTE and think that means correct selective tweeter lag in a Rephase filter and load that .wav format to APL1 and add to tweeter loop as below will get speaker system in sync.

Polarity set as normal for this XO scheme:
Polarity reversed:
That said possible better solution could be repair phase selective for tweeter so it act like a real minimum phase device then this XO point at 1050Hz will begin work by the book.
On APL Audio site they spec APL1 unit as QUOTE 96kHz sampling rate and that the user can also use his own synthesized FIR filters in .wav format to supply to APL1s unit’s FIR engine UNQUOTE and think that means correct selective tweeter lag in a Rephase filter and load that .wav format to APL1 and add to tweeter loop as below will get speaker system in sync.
Attachments

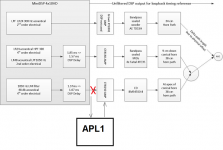
The I/O is very clean - its all digital until DtoA at the output of the MiniDSP. HDMI from the laptop to the AVR and TV and then Toslink to and through the DSPs. The MiniDSP has a balanced output into the amps.
Think know what you mean saying I/O is very clean but have before seen such clean chain perform perfect for music stream but misbehave when used with REW probably because of diverse SRC down the road and the long time frame it takes REW to finish the sweep. Now lets imagine that chain have bit trouble for precision in high frq area when used with the long sweep time frame then what we see for tweeter timing is really not there but show up on plots, think to investigate this chain once for all for precision in HF area would only need a single sweep with another tweeter bonded to same speaker cable as BMS sits now.
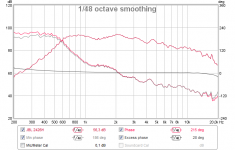
As done into raw 2426H example below push button "Estimate IR delay" then "Generate minimum phase" and set tick as legend below.
If sweep with other minimum phase tweeter device show that absolut phase tracks close to minimum phase curve then chain is clean and precise with REW sweeps but if absolut phase start show phase lag the higher the frq compared to minimum phase that belong to that particular amplitude response then chain is responsible the non minimum phase curves we see for BMS measurements.
Would love to see such other tweeter measured to be absolut sure about if BMS tweeter perform non minimum phase behavour that then could be selective repaired with APL1 unit.
Attachments
Last edited:
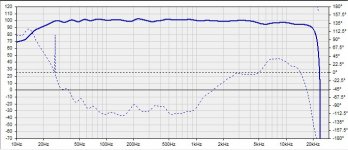
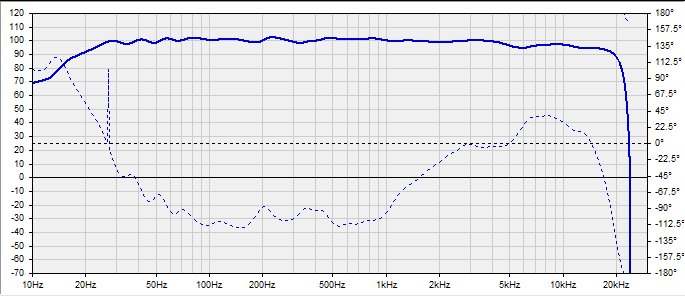
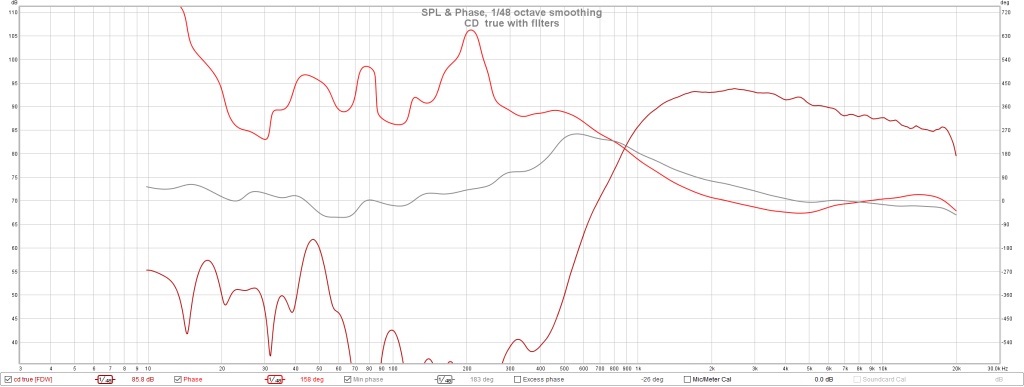
But this measurement of the CD alone, with filters on, shows the phase tracking close to the min phase. (Ignore anything below 200 Hz as there was low frequency background noise during the measurement. Washer/dryer is in the next room.)
Attachments

- Home
- Loudspeakers
- Multi-Way
- My Synergy Corner Horn and Bass Bins