Thanks for this George. It certainly brings back memories. IIRC, mine was the 1st editionFREQUENCY ANALYSIS
By R.B.Randall, B. Tech., B.A.
Revision September 1987
You will find it as
HANDBOOK: FREQUENCY ANALYSIS
under
PRIMERS and HANDBOOKS
(Log-in required)
https://www.bksv.com/en/Knowledge-center
Yes. The earlier reports that HOLMimpulse does RTA is probably due to this. We shouldn't call it RTA .. maybe log-analysis as opposed to lin-analysisThis means that with linear sweep as the reference, Holm is doing FFT and with log sweep as the reference, Holm is doing RTA. At least this is the case with these test files.
All the analysis of Pano's #1080 noise are correct.
The problem is a sweep is 'wideband' ONLY if you consider/process the whole thing. Short bits are very 'narrow band'. This creates a problem in eg HOLMimpulse, which has a max FFT size of 1M, if you are trying to look at George's 18s (1M8) sweeps.in the past I've had pretty good luck with that using HOLM, which is why I thought to try George's sweeps.
You can do it properly using 'overlap & save' but you must be very careful. Loadsa fiddly zero-padding, windowing, overlap issues to do it right.
I realized that the FR plots I posted are inverted. That's because I was using the vinyl sweeps as the reference, and comparing a perfect sweep to them. So I had to flip the response. See below, as these seem a lot more believable. Still not sure about what's going on circa 30Hz.
BTW, these are 1/12th octave smoothed.
Basically the Stanton and Shure are flat within the majority of the audio band.
I was very excited to see Pano's pics in #1018Alas, the Pano method isn't truly Angelo's method ... ... but more like what I started to try to do circa 1990 .. a swept filter.
They suggested it was possible to do a simple version of Angelo's method with nearly all the advantages except for an Impulse Response ... in particular, the huge increase in S/N from the very narrow 'tracking filter'.
I'm working with HOLMimpulse cos it appears to hide the least amount of juju from the user ... even though it still applies stuff without telling you. I still don't know why the Impulse Response is 2x the FFT size.
But #1018 says the IR has suddenly become a Linear Phase filter 😱 I suspect this is due to Goldwave RIAA and other stuff. Alas, I don't think those measurements are right either ie I don't think the Shure & Stanton are flat.
I've not been able to replicate Pano's incredible S/N in #997 & #1018.
In fact I've not been able to affect the S/N compared to George's original pics at all with different sweeps. Deconvolving the sweeps with a log sweep (whether via Audacity or HOLMimpulse's own stuff) only seems to apply the correct 3dB/8ve slope to 'flatten' the response.
We are not using what we 'know' about the input signal to help with our measurement S/N.
ie Pano's method isn't Angelo Lite 😱
________________
My conclusion is that we are a loo.oong way from getting a facsimile of the original sweep 'accurate' enough to reap the advantages of Angelo's method 😡
I'll have to revert to a much earlier 1990 approach and programme the swept filter explicity.
Last edited:
Yes, it's well worth a look, it's possible that an elusive hf mechanical resonant system has been captured alive..........George you might want to peek at the strain gage thread, I think we saw some cantilever artifacts and if you take out the 10dB/decade on the pink noise his EQ is getting pretty good.
Aside, on that SG thread it was good to see the topology for Kevin's SG preamp placing the cartridge as the cathode load in a µ follower. Great minds, and all that: a few years back I posted that topology as an ultra-minimal preamp sketch, using one valve bottle and one resistor for the whole preamp. I reposted earlier on this thread (IIRC).
LD
Last edited:
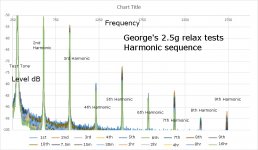
Here's the last of my analysis for George's 2.5g test for now. It show relative amplitudes of harmonics of the test tone, for all files on the same chart.
One might recall that an earlier post analysed 3rd harmonic distortion levels, and noted a strong correlation for reduced 3rd harmonic distortion with progressive number of tests/plays.
This chart illustrates that the same phenomenum appears to apply to all odd harmonic levels, and the effect is increasingly pronounced for higher order odd harmonics.
I can't resist pointing out a fact: slew rate limitation of a sine wave progressively makes a waveform become more triangular, with harmonic content of odd harmonics increasing in a tapered pattern remarkably similar to that observed here. And vica versa, of course: reduced harmonic distortion in this pattern would be consistent with improved slew rate with increasing test number/plays.
Also I note that even harmonic levels appear relatively unaffected by these tests, especially the 2nd harmonic. Weakly, I suggest any correlation with test number is in the opposite direction to that for odd harmonics, ie increases slightly with test number, if at all.
All very interesting, don't you just think ?
LD
Attachments
Last edited:
Hi George,Hi Hans
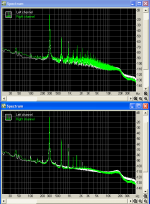
On the first attachment is the RMAA FFT of your 96k Chirp file.
On the second attachment is the RMAA FFT of your 96k file after IIR RIAA equalized through Audacity using Nyquist prompt :
(biquad-m s 1.315951e-02 -1.273543e-02 0.000000e+00 1.000000e+00 -1.867054e+00 8.674785e-01)
source: Website of Wayne Stegall - Digital Phono Equalization
Compared with what you showed in post #993, I think the RMAA 65536 samples FFT is quite descent.
George
Thank you for taking the trouble to play my Cirp.wav file, and yes, the 65K FFT's are looking quite good.
I hope you are convinced by now, that playing a Riaa corrected exponential sweep through a "flat amp" does not result in a flat FR.
But excuse me for my ignorance: your images go all the way up to 48Khz, which is what is to be expected with an Fs of 96 kHz.
So with a sweep of 18 sec, I would expect a 2 Meg FFT.
So how did you manage to use just a 4096 and a 65536 FFT ??
On the other hand, the 2 Meg FFT that you also tried, is bogus ??
Last but not least, I see no sin(x)/x attenuation at the high end of the spectrum with the 4096 and 65536 FFT's even in case of using a Kaiser window ??
So what you have is pure magic. I would love to know how you got this result.
Hans
I will be interested in the conclusions on this. I'm currently totally confused!
I forgot to mention last night, as part of the cartridge construction analysis I decided to sacrifice an old ortofon. On a whim have been collecting some historical cartridges for experimentation. Tonight was the stylus from a 'concorde STD' which had a pushed in cantilever. Popped it out and its a single donut construction. This has an open tube pushed or moulded in to the stylus, donut is pushed in from the back and stylus pushed in from the front. So for this model something needed to keep rubber in place whilst inserting stylus, but you can 'get at' the wibbly end to maybe add damping. Next step is to rummage for an OM era to rip up. Anyone know of any DJs who might be a source for worn stylii for experimentation?
I forgot to mention last night, as part of the cartridge construction analysis I decided to sacrifice an old ortofon. On a whim have been collecting some historical cartridges for experimentation. Tonight was the stylus from a 'concorde STD' which had a pushed in cantilever. Popped it out and its a single donut construction. This has an open tube pushed or moulded in to the stylus, donut is pushed in from the back and stylus pushed in from the front. So for this model something needed to keep rubber in place whilst inserting stylus, but you can 'get at' the wibbly end to maybe add damping. Next step is to rummage for an OM era to rip up. Anyone know of any DJs who might be a source for worn stylii for experimentation?
Hi George,
Thank you for taking the trouble to play my Cirp.wav file
Hi Hans.
Thank you for providing it!
and yes, the 65K FFT's are looking quite good.
That’s good enough for now.
I hope you are convinced by now, that playing a Riaa corrected exponential sweep through a "flat amp" does not result in a flat FR.
I am trying to digest it 🙂
But excuse me for my ignorance
I am honored to communicate with someone who has a refined sense of humor (in other words, you are kidding me 😀)
your images go all the way up to 48Khz, which is what is to be expected with an Fs of 96 kHz.
So with a sweep of 18 sec, I would expect a 2 Meg FFT.
So how did you manage to use just a 4096 and a 65536 FFT ??
On the other hand, the 2 Meg FFT that you also tried, is bogus ??
Last but not least, I see no sin(x)/x attenuation at the high end of the spectrum with the 4096 and 65536 FFT's even in case of using a Kaiser window ??
So what you have is pure magic. I would love to know how you got this result.
I am neither a magician, nor one who knows what he does with FFTs. A more precise description of me is a "monkey see monkey do”.
As you know I have the free RMAA that I use to do FFTs.
I click the buttons and it spits out curves.
For anything more informed, don’t ask me. Download the SW and see yourself what it does (the how it does it, is also unknown to me).
RightMark Audio Analyzer. Products. Audio Rightmark
I am all ears and I will always be for guiding me what is OK and what is not (best by using examples).
I will be honored by explanations. You have politely remarked many times since April that something isn't quite right with the FFT screenshots I post but the skull is thick and the content thicker, so it takes time 😱
That book I linked to in post #1087 will be my company for some good time. It is not an easy subject but I have to go through it.
George
We are not using what we 'know' about the input signal to help with our measurement S/N.
The sweep is always monotonic, and we know at exact time what exact frequency is. So we can take a short time window and run a relatively short FFT, not caring about frequency resolution, just to bin the level. From that we can deduce instantaneous level, and from timestamp the frequency. And move through the sweep. Ta da.
LD
I think we saw some cantilever artifacts and if you take out the 10dB/decade on the pink noise his EQ is getting pretty good.
Then it’s the possibility of a peak due to pink noise bandlimiting during track cut.
I guess we'll never know unless we have a recording of such a track played optically.
http://www.diyaudio.com/forums/atta...gauge-cartridges-dedicated-phono-stage-p1.png
http://www.diyaudio.com/forums/atta...e-cartridges-dedicated-phono-stage-sweep1.jpg
George
I don't want to go too far OT, but I've been thinking about that. Not a cart, but a scanner, as I used to do high resolution scans for a living. A flatbed scanner with a claimed optical resolution of 6400 DPI is quite affordable these days. Would that be enough?I guess we'll never know unless we have a recording of such a track played optically.
I figure that at 33.33 RPM groove speeds the sampling rate would be around 110K. That would get you about 110 pixels for a full cycle of a 1Khz sine. Enough? Of course that raster image would need to be converted to something like an audio signal for analysis. No idea how to do that. 😉
Record wear after 50 plays
The above link has electron microscope pictures of 50 plays with conical and elliptical stylus and weight from 1.5gms to 5 gms. I guess the Pics are from RCA labs.
Regards.
The above link has electron microscope pictures of 50 plays with conical and elliptical stylus and weight from 1.5gms to 5 gms. I guess the Pics are from RCA labs.
Regards.
George, thank you for the repeated play tests (#1019), specially your attention to 15-minute pretest warm-up and recording of ambient temperature. Behavior of the elastomer stylus support can be sensitive to temperature.
One (possibly trivial) procedural question: At what points during testing did you clean the stylus tip, and by what method? Any chance of cumulative tip contamination affecting tracing distortion?
One (possibly trivial) procedural question: At what points during testing did you clean the stylus tip, and by what method? Any chance of cumulative tip contamination affecting tracing distortion?
One (possibly trivial) procedural question:
At what points during testing did you clean the stylus tip, and by what method?
Hi Charlie. Thanks for asking.
Any question that has to do with vinyl/needle tip contamination is not a trivial question.
Vinyl dry cleaning was with the old Discwasher velvet brush.
Needle tip dry cleaning was with a soft brush (the brush that is included in the packaging of Denon DL-103 )
Both vinyl and needle were cleaned after each 15min warm-up music vinyl play. This means before the 1st test play and before the 11th, 12, 13th …19th test plays. I didn’t clean the tip between the 1st, 2nd, 3rd…10th play. The 1 to 10 plays were done by raising the arm and lowering the arm while the recoding continued, i.e. in one recording. Then I splitted this recording into it's 10 sections.
Any chance of cumulative tip contamination affecting tracing distortion?
Cumulative in the real sense of the word, I wouldn’t say, but dirt sticking in the needle yes (*). The room I did the tests is the living room and it’s not designated as a clean room.😀
In fact, the static increases –thus the potential to dust attraction- after each disc cleaning and I had to lower the needle at various radial points across the disk (not over the test track) to discharge the static before starting each test recording.
(*) Results of dirt sticking in the needle can be observed when doing a single tone track recording by watching the tone’s waveshape in the digital recording. It distorts it. It consequently alters the peaks spread in the FFT of that recording.
That was a case that I happened to capture in a recording while doing the 300Hz test with the Stanton at 2.5gr VTF. I mentioned the discrepancy in post # 918.
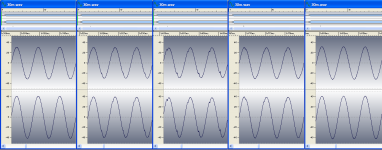
In the 13th playback (the after 30minutes), there is a mysterious glitch at the beginning of the recording for 30secs, which affected the FFT. So, for the diagrams only (*), I dropped the data of the 13th playback and I replaced it with the average of the 12th and the 14th recording.
I noticed there was a problem due to the dirty FFT and I opened the wave editor to see the waveforms.
The dirt remained on the needle for 321ms but the damage on the FFT of the 18s 300ms recording was pronounced (see the screenshots with/without the dirty section).
If you have downloaded those test files you can review and analyze the file yourself.
George
Attachments
Yes. This is what I started with circa 1990 and need to replicate this Millenium... we know at exact time what exact frequency is. So we can take a short time window and run a relatively short FFT, not caring about frequency resolution, just to bin the level. From that we can deduce instantaneous level, and from timestamp the frequency. And move through the sweep.
There are some finicky issues with windowing & overlap if you want to do it properly. Won't be able to start until next week.
Randall, the B&K book that George linked to is good on bandwidth & frequency resolution.
Also Digital Signal Processing - Oppenheim & Schafer
https://books.google.com.au/books/about/Digital_Signal_Processing.html?id=vfdSAAAAMAAJ&redir_esc=y
and JOS
https://ccrma.stanford.edu/~jos/
Just to wrap up a few loose ends re: analysis of George's 2.5g 300Hz tone tests:
George enquired whether the other channel exhibited similar behaviour. I briefly analysed the other channel and found similar strong rank correlations for improvement in lf stability, increase in level of test tone, reduction in odd harmonic distortion, and improvement of noise floor with progressive increase in test number/plays. Even-harmonic distortion, especially 2nd, was relatively unaffected, as was the case for the first channel analysed.
A few words about the test tone itself: it is 300Hz@+12dB, presumably a sine trackability test that is pretty hot. Interestingly, because it has a relatively low frequency, it also has low peak groove curvature (about 400um), and so has low stylus acceleration of only about 30G with only low associated inertia/mass forces.
Where 300Hz@+12dB is demanding for trackability involves the peak groove angle at the zero crossing point of groove shape. In this case I calculate perhaps about 25deg, whereas most good carts will track to a limit of only about 30deg. This represents peak stylus velocity of about 16.5cm/s, ie near typical trackability limits.
Force opposing stylus motion under these conditions at 300Hz is classically considered to be provided by (damping) impedance within the cartridge suspension, and is coupled to the stylus via the cantilever. So this test seems good to me in terms of providing conditions to observe flex. Be that from suspension, cantilever or vinyl compliance.
LD
Last edited:
Thanks Lucky.
I found this in Yosh site.
ƒeƒXƒgƒŒƒR�[ƒh
Translation is bad but if someone has access to that 1967 JAES paper of Bastiaans he may inform us.
George
I found this in Yosh site.
ƒeƒXƒgƒŒƒR�[ƒh
Translation is bad but if someone has access to that 1967 JAES paper of Bastiaans he may inform us.
George
Attachments

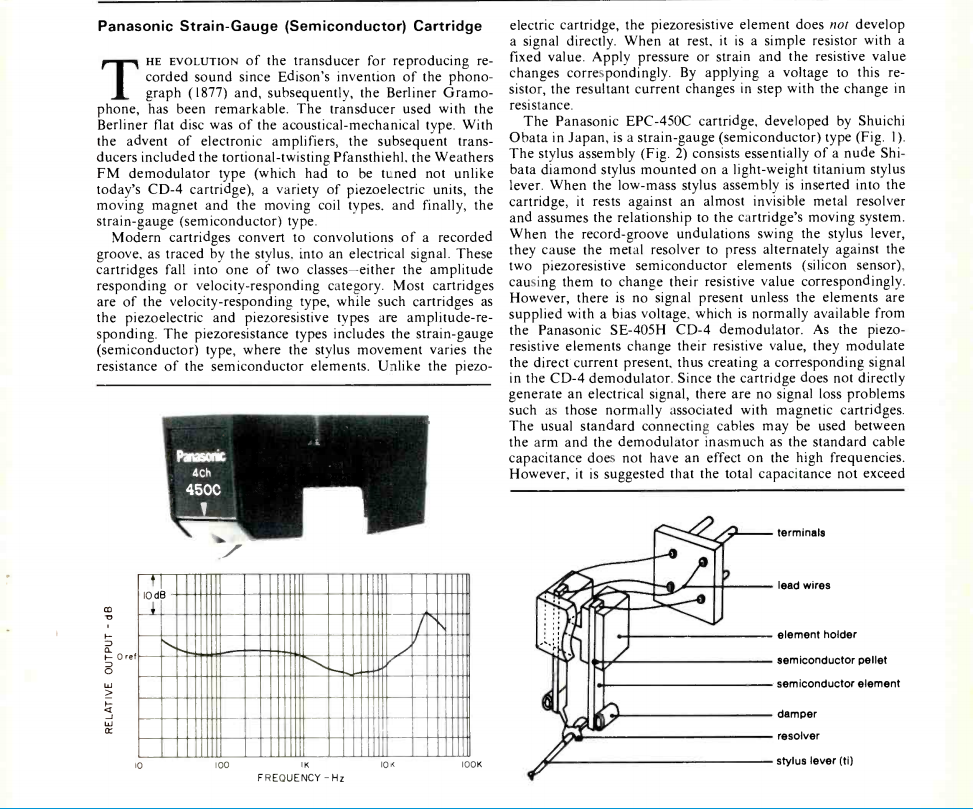
Here is the 1st page from the article of the German magazine ANALOG ACTUELL 3/2003
http://www.aaanalog.de/media/analog/pdf/lpaa3_03.pdf
Image 1
Change in the level of the measurement disc (various high frequencies) versus number of playbacks (1 to 150),
a) tracking force 2 p
b) tracking force 3.5 p
c) tracking force 5 p
Image 2
Transfer curve of the system with which the results in the images 1
were obtained .
a) with moderate operation terminating resistor 2.7 ohms / 4.7 nF (as used in the tests)
b) open
The cartridge used was the RFT Ziphona System MS 15
http://radio-ftv.podspot.de/files/DSC02640.JPG
http://radio-ftv.podspot.de/files/DSC02641.JPG
http://radio-ftv.podspot.de/files/DSC02642.JPG
This part of the article says that under 3p tracking force there is no discernible change in HF tones with multiple playback of the same vinyl track. This behavior also varied a lot depending on the vinyl material from brand to brand.
George
Attachments
Thanks, George. Yes, Yosh's excellent resources explain what I was trying to say. There's a diagram that shows at what part of a sine cycle that force is applied, depending on whether spring, damping or inertia is making the demand.
Spring is associated with big groove displacements, damping with steep groove angles, and inertia with tight groove curvature.
Strictly, it's not a frequency thing, rather a matter of the groove shape which, in real programme material, comprises all these factors: they are all in play at the same time. Of course, it's true that low frequency sine waves have big displacements for a given velocity, high frequencies have tight curvature for a given velocity, and mid frequencies have neither.
But it's an artificial construct to think of frequency 'partitions' to cartridge behaviour since strictly it's about displacement, angle and curvature.
For example, in the case of that 300Hz@+12dB tone test of yours, both groove displacement (90um) and angle (25 deg) are quite stressed, near performance limits, but curvature is relaxed. So even if the stylus stays in contact with the groove, high forces are applied via teh cantilever, and if anything can flex one would think it will at the locations of high stress on the groove.
Interesting.......Here is the 1st page from the article of the German magazine ANALOG ACTUELL 3/2003....
Image 1
Change in the level of the measurement disc (various high frequencies) versus number of playbacks (1 to 150),
a) tracking force 2 p
b) tracking force 3.5 p
c) tracking force 5 p
Can't work out what's physically going on at all, but interesting in the context of your tests which appear to show a similar trend !
BTW, in your 2.5g test with modulation near the trackability limit, it's like double the stylus-groove peak force ie equivalent of about 5g in a lightly modulated groove.........I wonder if your tests are showing record wear due to high modulation?
LD
Last edited:
Also, Shure published an article mentioned by Richard, which presents that in progressive playback tests @1kHz, 3rd harmonic distortion can be observed to improve with number of plays.
In the past I chose to disregard this, partly because it lacks a satisfying explanation, and partly because the article appears to be marketing focussed.
Nevertheless, here's what the article presented:
LD
In the past I chose to disregard this, partly because it lacks a satisfying explanation, and partly because the article appears to be marketing focussed.
Nevertheless, here's what the article presented:
Test 1: 2nd and 3rd harmonic distortion versus number of plays
*
Test 2: Same as Test 1 but at a tracking force of 1.5 grams.
*
Cartridge: V15 Type III
*
Tips: biradial and hyperbolic
*
Signal: CBS STR-100, bands 3A and 3B, 1 kHz
*
Tracking Force: 0.75 gram
*
Number of Plays: 100
Results:
*
Tips: biradial and hyperbolic
*
Signal: CBS STR-100, bands 3A and 3B, 1 kHz
*
Tracking Force: 0.75 gram
*
Number of Plays: 100
Results:
2nd harmonic with biradial:
no significant change on either channel.
*
2nd harmonic with hyperbolic:
no significant change on either channel.
*
3rd harmonic with biradial:
decreases about 33% of original value.
*
3rd harmonic with hyperbolic:
decreases about 40% of original value.
no significant change on either channel.
*
2nd harmonic with hyperbolic:
no significant change on either channel.
*
3rd harmonic with biradial:
decreases about 33% of original value.
*
3rd harmonic with hyperbolic:
decreases about 40% of original value.
Test 2: Same as Test 1 but at a tracking force of 1.5 grams.
Results:
2nd harmonic with biradial:
increases by an average of 20% from original value.
*
2nd harmonic with hyperbolic:
decreases by an average of 40% from original value.
*
3rd harmonic with biradial:
decreases by about 33% from original value.
*
3rd harmonic with hyperbolic:
decreases by about 33% from original value.
increases by an average of 20% from original value.
*
2nd harmonic with hyperbolic:
decreases by an average of 40% from original value.
*
3rd harmonic with biradial:
decreases by about 33% from original value.
*
3rd harmonic with hyperbolic:
decreases by about 33% from original value.
LD
Last edited:
For clarification, I mean that the 2.5g 300Hz tone tests show a correlation for small increase in test tone level with progressive number of tests/plays.Can't work out what's physically going on at all, but interesting in the context of your tests which appear to show a similar trend !
The 2.5g 300Hz tone tests also show a strong correlation for significant reduction in 3rd harmonic (and odd harmonics generally) with progressive number of tests/play.
LD
- Home
- Source & Line
- Analogue Source
- mechanical resonance in MMs