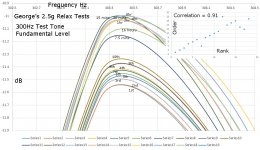
Here's more analysis of George's 2.5g relaxation tests, this time looking at variation of peak level of the 300Hz test tone, and the sequence of how it varied with time progression of the tests.
Firstly, it is worth noting that variation was small, for the back-back tests about 0.2dB, and for the time delay tests about 0.15dB. And the test groups appear to be separated.
There is strong correlation between progressive number of tests and ranking order of the 300Hz test tone level, coefficient of 0.91 overall. That is to say, there was very probably a real effect that peak level of the test tone increased with increasing number of plays performed. Albeit it by a small amount.
This is especially probably true for the back-back test group, where the coefficient within that test group was 0.94 (!). For the time delay test, it was less probable to be true, 0.28, but overall the correlation for the complete test was 0.91, very strong.
Interesting ?
LD
Attachments
Last edited:
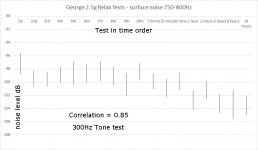
Here's another analysis of George's 2.5g relax tests. This one looks at surface noise level in the 750-800Hz region versus progression of test number/time.
Overall there was a strong correlation (coefficient = 0.85) between reduction in surface noise in the 750Hz to 800Hz region and progressive number of tests/plays. Surface noise reduced by c 4dB over the course of the tests. This change was progressive, but probably to a lower extent for the back-back tests than for the rest time tests which showed a very strong coefficient and significant change.
Given the strong correlation coefficient, there very probably was a real reduction in surface noise with increasing number of tests/plays performed.
I chose the region 750Hz to 800Hz to analyse, for convenience since it was reasonably clear of the test tone/harmonics and because that range is very audible. By inspection, the noise floor in that region generally followed the same pattern of change as much of the audioband in this test.
The error bars shown are +/- 2 sigma.
Anyways, here's the plot. Very interesting, eh ?
LD
Attachments
Last edited:
The error bars shown are +/- 2 sigma.
Anyways, here's the plot. Very interesting, eh ?
Now I feel much more comfortable.
I always remember a sig line of SY which went something like this:
"Where amateurs look for trends in the data, professionals look for error bars."
Lucky as I’ve said, keep notes.
Consider arranging for a document where you will include all your observations , diagrams, statistics and comments.
George
Interesting ?
Yes it is, and thanks for doing that work! But what's going on here? This looks like the direct opposite of what I would expect. Or am I seeing it backward?Very interesting, eh ?
Yes, and in the past I've had pretty good luck with that using HOLM, which is why I thought to try George's sweeps.
FYI, here is how HOLM plots white, pink and brown noise against its own 5 sec log sweep. All noise files 70 seconds in length, 44.1K, 16 bit.
Thanks Michael.
Again, this is RTA not FFT
See Figs 11, 12
https://www.bksv.com/media/doc/17-197.pdf
For control, it would be useful if you could upload these noise files
George
I can't attach them here, too big. Maybe Dropbox. There's nothing unique about them. They were generated with Audacity at the amplitude, length and sample rate desired. In this case 44.1KHz sample rate and 1m10s duration, amplitude 0.8 (default). Saved as 16 bit mono files. Anyone with Audacity can make the same files.
Some reading
FREQUENCY ANALYSIS
By R.B.Randall, B. Tech., B.A.
Revision September 1987
You will find it as
HANDBOOK: FREQUENCY ANALYSIS
under
PRIMERS and HANDBOOKS
(Log-in required)
https://www.bksv.com/en/Knowledge-center
George
FREQUENCY ANALYSIS
By R.B.Randall, B. Tech., B.A.
Revision September 1987
You will find it as
HANDBOOK: FREQUENCY ANALYSIS
under
PRIMERS and HANDBOOKS
(Log-in required)
https://www.bksv.com/en/Knowledge-center
George
Attachments
Thanks for all the docs, George. Good coverage, but probably more time than I care to put into it. 
Interestingly the only signals I have trouble with in HOLM - are sweeps! Noise and music, no problem.
Interestingly the only signals I have trouble with in HOLM - are sweeps! Noise and music, no problem.
I can't attach them here, too big. Maybe Dropbox. There's nothing unique about them. They were generated with Audacity at the amplitude, length and sample rate desired. In this case 44.1KHz sample rate and 1m10s duration, amplitude 0.8 (default). Saved as 16 bit mono files. Anyone with Audacity can make the same files.
O.K. I did it.
We need a common base to start.
I hope this will ease the communication and help the understanding.
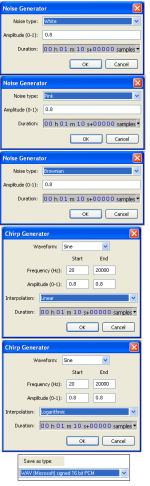
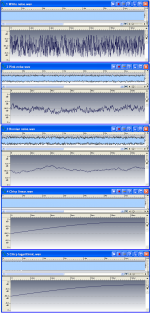
All files generated in Audacity 2.1.0
44.1KHz sample rate and 1m10s duration, amplitude 0.8.
Saved as 16 bit mono files (3087000 samples)
1 White noise
https://www.dropbox.com/s/cp7fgwfczzt82e0/1%20White%20noise.wav?dl=0
2 Pink noise
https://www.dropbox.com/s/a44evzqxysm6gts/2%20Pink%20noise.wav?dl=0
3 Bronian noise
https://www.dropbox.com/s/p9zfyrzerx6ba52/3%20Bronian%20noise.wav?dl=0
4 Chirp linear
https://www.dropbox.com/s/zoay2nqs9j64q49/4%20Chirp%20linear.wav?dl=0
5 Chirp logarithmic
https://www.dropbox.com/s/pt5wf0yqql1n9in/5%20Chirp%20logarithmic.wav?dl=0
George
Attachments

You're welcome, Pano, and thanks esp for input to sweep analysis.Yes it is, and thanks for doing that work! But what's going on here? This looks like the direct opposite of what I would expect. Or am I seeing it backward?
Well, something interesting, and very probably real, has been captured, for sure. And you're not seeing it backward !
I agree, the 2.5g results seem surprising/counter-intuitive at face value. However, the point of doing such measurements and analysis rigorously is to be confident in establishing facts/measurements associated with the back-back and relaxation playback tests. Whatever they may be. So I'm confident we are looking at real effects here, and very much look forward to moving on to thinking through and discussing physical causes as soon as the facts are gathered and posted. I hope to complete analysis of George's 2.5g back-back & relax files shortly.
Thanks, George. Yes I keep notes, and will consider writing it up because it's already a fair investment in time, especially yours. But first, I am interested to discuss what physically might be going on, as soon as analysis of the 2.5g tests is complete.......I always remember a sig line of SY which went something like this:
"Where amateurs look for trends in the data, professionals look for error bars."
Lucky as I’ve said, keep notes.
Consider arranging for a document where you will include all your observations , diagrams, statistics and comments.
George
BTW, rank correlation is a neat tool for identifying and assessing probable significance of relationships between parameters, when one doesn't know the nature of the relationship or even whether it is linear, and in the presence of noise or imperfect data. The coefficients here are very strong, and I think that is confirmed by common sense looking at families of graphs.
So I'm optimistic this effort will lead somewhere interesting and conclusive, though who knows where that might be right now ?
LD
Last edited:
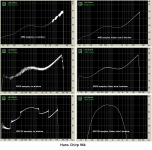
All looks good, thanks George.Low resolution RMAA FFTs of the above files behave properly.
4096 samples, no window
George
LD
Thanks George, those display as expected.Low resolution RMAA FFTs of the above files behave properly.
 Note that my HOLM graphs show pink as flat, probably because I used a log sweep as the reference.
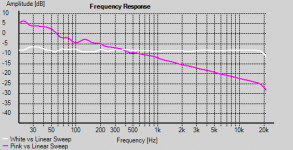
Yes I keep notes, and will consider writing it up
Good !
because it's already a fair investment in time, especially yours.
No, yours. Mine is done, belongs to the past.
But first, I am interested to discuss what physically might be going on
Hold it a bit back and don’t build any hypothesis till you have applied the same analysis methodology on all the data (Stanton reading the 300Hz with 1.6gr, 2.5gr, Shure reading the 1KHz and possibly revisiting the Stanton reading the freq sweep).
If you start thinking for a cause early on, you may be influenced in the way you look at the data.
If and when the results show that a certain parameter needs more testing, I am willing to proceed. The only problem is that the ambient temperature has started to increase here, something that will influence the results.
Confirmed. Plotted against a linear sweep, White shows flat, Pink declines.
Makes sense.
Fine. This means that with linear sweep as the reference, Holm is doing FFT and with log sweep as the reference, Holm is doing RTA. At least this is the case with these test files.
George
Once LD does the further analysis, and if we do see a trend in your recordings, we need to have other people replicate the experiment. I know that Kevin K and Scott W both have test discs, maybe they can do the same tests. My TT is packed away right now, or I'd do the same.
Hi Hans
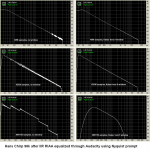
On the first attachment is the RMAA FFT of your 96k Chirp file.
On the second attachment is the RMAA FFT of your 96k file after IIR RIAA equalized through Audacity using Nyquist prompt :
(biquad-m s 1.315951e-02 -1.273543e-02 0.000000e+00 1.000000e+00 -1.867054e+00 8.674785e-01)
source: Website of Wayne Stegall - Digital Phono Equalization
Compared with what you showed in post #993, I think the RMAA 65536 samples FFT is quite descent.
George
Attachments
I know that Kevin K and Scott W both have test discs, maybe they can do the same tests.
Kevin's the one with the quality phono two TT's both much more carefully setup than mine. I found out he is only 10min away so it is easy to do a few tests now and then. George you might want to peek at the strain gage thread, I think we saw some cantilever artifacts and if you take out the 10dB/decade on the pink noise his EQ is getting pretty good.
Well I think we have at least proven one thing. It was said that the older Hi-Fi news test disk (HFN001) had pink noise that wasn't pink, but HFN002 is better. Looks like I'll need a new record. Shame as that means I'll have to hold out on the ortofon record for a bit (I can't spend more on test records than on actual vinyl in any period 😀 ).
I am finally making progress on the mouser order to build up my balanced boards though. Might have them built by xmas...
I am finally making progress on the mouser order to build up my balanced boards though. Might have them built by xmas...
- Home
- Source & Line
- Analogue Source
- mechanical resonance in MMs