I don't know what method is used by HOLMImpulse. I do know that you can use noise as the reference and it works. A rough graph, of course, but it works. Also if you use swept sine as the signal, HOLM will show you harmonics, it's an option in the Import window. Doesn't always work, and I don't know why not.Angelo's method requires EXACT knowledge of the original sweep. It would give you the Impulse Response (& hence the Frequency Response including Phase) of ONLY the fundamental ..
AND
.. as many harmonics as you like up to Nyquist in the theoretically shortest possible time ...
The algorithm for a 18 sec exponential sweep starting at 20Hz is Sin(20*2Pi*((1.47^t)-1)/Ln(1.47)).Hans Polak, how did you apply your RIAA pre-emphasis to your log sweep?
I calculated all values in time for Fs=96Khz and Fs=192Khz, with 10 decimal places.
These time and voltage values were placed in a Wordpad file and imported as PWL file in LTSpice.
In the LTSpice, after the voltage source playing this PWL file, I placed a passive Anti Riaa network, accurate within 0.01dB and with phase errors <0.1degree from 20 to 20Khz.
The output of the Anti Riaa network was converted by LTSpice into a .Wav file.
I do not agree with you that a higher Fs of 48Khz does not make sense for several reasons:
1) The computed FFT spectrum will be multiplied with a sinc function caused by Fs, reducing the amplitude at the high end of the spectrum.
Without correcting this, 20Khz will be reduced at Fs=48kHz by 2.6dB, while at Fs=192Khz only by 0.16dB, possibly leading to false interpretations.
2) Conversion into a .Wav from a PWL file, does not provide the same result for different PWL files.
When creating a PWL file in 192Khz and then producing a 96Khz .Wav file, results in much less noise as when creating a 96Khz .Wav file from a 96Khz PWL file. See both FFT images below.
And when producing a 192Khz .Wav file from a 192Khz PWL file, the Sinc attenuation at 20kHz is insignificant, see image #1046 in compare to the images below.
Hans

To echo Richard's comment...
These things are better done at the most basic level directly in software that gives the user complete control of the algorithms. I'm not saying there is a problem here, but IME SPICE transient analysis can introduce artifacts without using some care. I need to check LTSPICE but our SPICE has added hooks to remove artifacts for FFT's of transient analyses.
As I said I have not tried it in LTSPICE but a transient analysis should have settings to return a full double precision noise floor (-300dB) from an FFT if needed. I assume Angelo used the libraries that came with the CoolEdit plug-in SDK which included a full C++ FFT suite (I don't know if MIT's FFTW was around back then).
Angelo's method requires EXACT knowledge of the original sweep
These things are better done at the most basic level directly in software that gives the user complete control of the algorithms. I'm not saying there is a problem here, but IME SPICE transient analysis can introduce artifacts without using some care. I need to check LTSPICE but our SPICE has added hooks to remove artifacts for FFT's of transient analyses.
As I said I have not tried it in LTSPICE but a transient analysis should have settings to return a full double precision noise floor (-300dB) from an FFT if needed. I assume Angelo used the libraries that came with the CoolEdit plug-in SDK which included a full C++ FFT suite (I don't know if MIT's FFTW was around back then).
Last edited:
I was curious what different software might do to measure so I looked at F.R. of some sweeps. in RightMark. Hmmm.... Not a flat graph at all. And I know my sweeps are flat because they are computer generated, and they are obvious looking at the waveform. 
I just timed a brute force 2 million point convolution at about 5 1/2 hr. on my laptop. One sees the power of the FFT. I have not tried to break Anaconda Python on FFT size, 40 million points is fine. An experiment I want to try is to filter an entire song with one giant FFT manipulation.
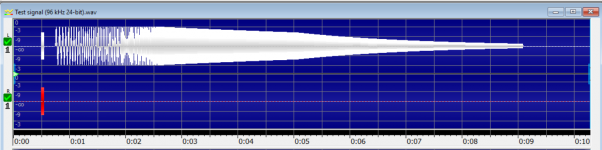
RMAA uses a log sweep of decreasing amplitude as a reference. See the waveform below. Apparently when running a Frequency Response on a wave file, this is the reference. If this file is saved and then loaded, it plots flat (not shown). Flat amplitude sweeps look ramped up. And the vinyl sweeps are just a mess.
Attachments
That looks suspiciously like an old standard 318us pole (500Hz) used in the recording industry. One of the CBS labs disks has this track. I think it eliminates excessive excursion at the low end.Flat amplitude sweeps look ramped up.
The algorithm for a 18 sec exponential sweep starting at 20Hz is Sin(20*2Pi*((1.47^t)-1)/Ln(1.47)). ... loadsa good stuff about using LTspice to apply RIAA
Thanks for this Hans. I rather suspected this.
This is a windowing artifact.1) The computed FFT spectrum will be multiplied with a sinc function caused by Fs, reducing the amplitude at the high end of the spectrum.
Without correcting this, 20Khz will be reduced at Fs=48kHz by 2.6dB .... creating a PWL file in 192Khz and then producing a 96Khz .Wav file, results in much less noise as when creating a 96Khz .Wav file from a 96Khz PWL file.
View attachment 619386
There's absolutely no reason why a 48kHz fs signal shouldn't be absolutely accurate for stuff that only happens below 20kHz
You need to deal with this on several fronts.
One of the most important/useful is Guru Wurcer's shifty shifts. I used this circa 1990 but his Linear Audio articles are the first time I've seen it in print.
A limited length FIR (which is what these FFT measurement records are) MUST have phase=0 at Nyquist & DC. If you want it to have eg 90 degrees at HF like RIAA, it will give serious errors as it nears Nyquist. Guru Wurcer's shifty shifts add a small frequency independent delay to get the phase to 0 at Nyquist.
You should also try to ensure your signal/measurement ends at 0
I need to deal with several beach bum issues but should be able to do more serious work on this whole thing by end of June. Please poke me if I don't.
_______________________
Anyone got info on Goldmax RIAA and whether it is EVIL Linear Phase ?
Last edited:
Thanks George.Mine is post #1019. There you’ll find single frequency 1kHz recordings.
They are not for checking frequency response, rather to check the behavior of vinyl under repeated playbacks (play 1 to 10) and the recovery behavior under progressively delayed replays (play 11 to 19).
I can't see any funnies in these measurements or the analysis that you and other people have posted on them.
Analysing 'single' frequencies for THD is what all FFT packages do well as it is perhaps the simplest use of FFTs with fewest gotchas. 'Simple' frequency response has many more gotchas as we are finding out.
You can use ANY wideband signal as the reference. Even music. There's been talk of using music to characterize a PA system on the fly and IIRC, Angelo has a paper on this.I don't know what method is used by HOLMImpulse. I do know that you can use noise as the reference and it works. A rough graph, of course, but it works.
The type of signal you use affects how quickly you get a good measurement in the presence of noise. You ALWAYS have noise. Also how it is affected by non-linear distortion.
The swept sine type signals allow you to measure distortion too. Angelo's method in a single sweep. TDS (linear sweep) in multiple sweeps.
IIRC, Dip. Ing. Wuttke of Schoeps or the Dynamic Duo (Lipshitz & Vanderkooy) have written about the pros & cons of the different methods. I'd be surprised if Klippel didn't too .. but nearly all his good stuff came out when I was bush so I haven't read much of it.
The ranking is sorta
- Angelo's method. By a large margin especially for acoustic measurements
- MLS & TDS depending on whether you want THD and how much headroom you've got. Roughly equal for frequency response.
- other 🙂
This is almost certainly Angelo's method. There really isn't any reason for using anything else these days. The latest Clio & Audio Precision use it too.Also if you use swept sine as the signal, HOLM will show you harmonics, it's an option in the Import window. Doesn't always work, and I don't know why not.
IIRC, AP named their latest instrument after Angelo and presented him with one in recognition.
RMAA uses a log sweep of decreasing amplitude as a reference. See the waveform below. Apparently when running a Frequency Response on a wave file, this is the reference. If this file is saved and then loaded, it plots flat (not shown). Flat amplitude sweeps look ramped up. And the vinyl sweeps are just a mess.
Oh oh!
How did you manage to extract this log sweep Michael?
One of the most important/useful is Guru Wurcer's shifty shifts
What is this “shifty shifts” Ricardo?
George
Easy. Down at the bottom, the floppy disc icon for Generate/Analyze. It will make a calibration file and a test file.Oh oh!
How did you manage to extract this log sweep Michael?
Oh oh!
How did you manage to extract this log sweep Michael?
What is this “shifty shifts” Ricardo?
George
This is just a snippet the frequency domain version of the signal is just a complex number (magnitude and phase), if the negative frequencies are forced to be the complex conjugate of the positive ones the inverse is a real only time domain signal. The Fs_at_f function just returns the complex frequency response for any set of poles and zeros.
#The "trick". The phase must be rotated at each frequency to eliminate
#the abrupt discontinuity between fs/2 and -fs/2 in the frequency domain.
#This dramatically reduces ringing in the time domain substituting a slight
#delay which does not hurt the minimum phase properties.
phz = -angle(Fs_at_f(Poles,Zeros,fs/2))
#Fill the array with the response up to fs/2 and fill the negative frequencies
#with the complex conjugate which guarantees a real only inverse FFT. The phase
#rotation is simply a multiply by e to the jTheta.
for k in range(0,int(fs)/2-1):
Fdomain[k+1]= exp(2j*phz*(float((k+1))/fs))*Fs_at_f(Poles,Zeros,k+1)
Fdomain[fs-1-k] = conj(Fdomain[k+1])
Last edited:
The attenuation at the high end of spectrum is indeed a windowing artifact, but when not compensated for may lead to false conclusions.This is a windowing artifact.
The noise on the other hand is nor a windowing artefact at all, but is caused by the piecewise linear interpolation of LTspice between the samples. This is not a step by step PCM signal.
When converting into .wav file, a point somewhere on this line is taken, causing an error. Hence, the more points generated, the smaller the error resulting in less overall noise.
I agree when talking about a proper PCM signal that is also corrected for the sinc attenuation, and when a very sharp analogue filter is used after D/A.There's absolutely no reason why a 48kHz fs signal shouldn't be absolutely accurate for stuff that only happens below 20kHz
That's exactly the reason why most current Audio D/A converters do the conversion at 192kHz, enabling the use of a much simpler filter.
Hans
And, George has invested significant effort in pursuit of that, plus some of us are investing significant effort to analyse the results of his excellent and careful measurements.I've suggested an experiment that addresses plastic deformation on vinyl playback.
Actually, it was White who presented that vinyl/tip interface is dominated by damping, rather than spring. Personally, I could live with that, and the parameters presented. IMO this is consistent with small/no meaningful indentation, however it isn't proof.lucky, your contention is that little or no vinyl deformation takes place on playback. While you accept the vinyl/tip interface provides damping, you claim it does not introduce a significant "stiffness" element to the complex moving assembly which includes wobbly cantilevers etc.
On the basis of White's figures and classic bending physics, a cantilever is more flexible than vinyl spring, by a factor of between 1 and 2 orders of magnitude.
I can't think of anything better right now than analysis and interpretation of George's measurements of relaxation tests. So let's see where that leads: it already looks promising and very interesting to me.Would you like to dream up a repeatable experiment (ie one that some follower of this thread can carry out) .. that would check for elastic deformation in a simple conclusive manner.
LD
Last edited:
.. and there's Guru Wurcer is lecturing me on using too much hi-falutin maths & theory in these forums 😱🙂😱🙂This is just a snippet ... the frequency domain version of the signal is just a complex number (magnitude and phase), if the negative frequencies are forced to be the complex conjugate of the positive ones the inverse is a real only time domain signal. The Fs_at_f function just returns the complex frequency response for any set of poles and zeros.
(with quotes from Guru Wurcer's articles & software)
Hans Polak, is it convenient to introduce a small delay in LTspice?
You might want to try tweaking that and look at the effect on your 'noise' & windowing artifacts.
It only needs to be between 0 and 0.25 * 1/fs
Is this stated in any of the LTspice documentation?Hans Polak said:The noise on the other hand is nor a windowing artefact at all, but is caused by the piecewise linear interpolation of LTspice between the samples.
It's very unlikely to be the case.
The sensible way to interpolate is to simply do a sampling frequency up conversion. You do this by zero padding the Complex Frequency representation to create an FFT record twice the original size & then IFFT. No extra computation required.
But it doesn't change the need for 'shifty shifts' 😀
Last edited:
Originally Posted by Hans Polak
The noise on the other hand is nor a windowing artefact at all, but is caused by the piecewise linear interpolation of LTspice between the samples.
Which is what we turn off along with all the tolerances on convergence.
For instance, sweep time from 0 to 10ms by 10ms/8192 and setting a mode flag stops the transient at exactly the time steps and converges to 64 bit float answers. You still have to worry about contamination from an initial transient.
Richard this behavior is not unique, SPICE even predates PC's and computers had very limited resources and speed. It was common to say converge to only e-5 accuracy to eliminate as much computation as possible and still get "close" answers. The standard was to run the transient analysis and only save points that bounded your tolerances asking for points in between resulted in an interpolated answer supposedly always also bounded by your tolerances.
Last edited:
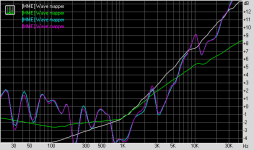
Yes, and in the past I've had pretty good luck with that using HOLM, which is why I thought to try George's sweeps.You can use ANY wideband signal as the reference. Even music.
FYI, here is how HOLM plots white, pink and brown noise against its own 5 sec log sweep. All noise files 70 seconds in length, 44.1K, 16 bit.
Attachments

- Home
- Source & Line
- Analogue Source
- mechanical resonance in MMs