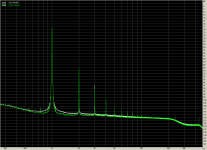
How have you done the FFTs? What size? Windowing? Zero padding? bla bla
What programme are you using for the FFTs?Size 2^21, no zero padding.
From this it appears that applying the RIAA pre-emphasis is giving the huge amount of 'noise' .. probably a 'windowing' effect.
In #993, you show 2 pics.Can you be a bit more specific. What noise, where do you see noise ?
The second is a Farina/B&K/beach bum log sweep with its -3dB/8ve slope on the spectrum and slight thickening from Gibb's-type effects .. about 2dB @ 22Hz and 1dB @ 20kHz
The first is after you applied your minimum phase RIAA pre-emphasis. The thickening is now between 2 to more than 6dB. This 'thickening' is noise and represents uncertainty in the measurement.
The first is after you applied your minimum phase RIAA pre-emphasis. The thickening is now between 2 to more than 6dB. This 'thickening' is noise and represents uncertainty in the measurement.
If you picked the math apart it's probably a predictable artifact due to several things.
The first is after you applied your minimum phase RIAA pre-emphasis. The thickening is now between 2 to more than 6dB. This 'thickening' is noise and represents uncertainty in the measurement.
Assuredly! That's why I keep asking people how they do their FFTs.If you picked the math apart it's probably a predictable artifact due to several things.
I show in #921 that these details can result in +/-20dB variation at HF 🙂
____________________
Hans, how did you apply your RIAA pre-emphasis to your sweep? An analogue circuit? Calculating the minimum phase? The digital Hilbert transform?
Was the resulting sweep longer after you applied this?
BTW, the last 2 are NOT the same though it is often useful to pretend they are. And there are things you can do to make them closer too .. eg Guru Wurcer's shifty shifts. 😀
____________________
In case anyone forgets, the aim of the exercise is to get better measurements of the frequency response of a cartridge. The early naive FFTs are MUCH worse than a Jurassic B&K 2307 recorder.
The goodness criteria is whether the measurement is suitable to derive digital EQ for the cartridge. I'm prepared to sacrifice loadsa theoretical pedantism for this. eg a B&K 2307 is certainly NOT a straightforward 'linear' measurement tool.
Last edited:
To take full advantage of Angelo's method, your 'computer generated sweep' needs to EXACTLY the same as the original.Thanks, that's what I was figuring. I used several different sweeps to compare, all worked, 10 sec, 18 sec, 21sec, but seemed to be off at the top, as you mention.
There are various types of measurements that can relax this requirement but the conditions have not been properly explored. In effect, we are exploring one specific instance of this .. the use with HFN002 Tr2 band7.
Did you get 'similar' results with 10s & 21s?
I would try to match the length as exactly as possible.
Small changes to start & end frequencies are also important. The sweep I posted in #921 actually starts at 19.6Hz but I can't for the life of me figure out the end frequency. It might be 22050Hz cos I might have used it to test anti-aliasing filters in 44.1kHz systems.
My guess, (at this stage it is only a guess) is that exciting the arm/cartridge resonance is giving warp/wow.One thing that shows up everywhere, even FFT, is the big bump at ~32Hz. What is that? You can actually see it modulate the entire sweep waveform.
The 'matched filter' provided by Angelo's method has a 0.055Hz bandwidth so frequency modulation from warp/wow can easily take it out of the filter passband. George's 'phase modulation' view is also appropriate.
We are still not quite there but a lot closer than at #921.I realized that the FR plots I posted are inverted. That's because I was using the vinyl sweeps as the reference, and comparing a perfect sweep to them. So I had to flip the response. See below, as these seem a lot more believable. Still not sure about what's going on circa 30Hz.
BTW, these are 1/12th octave smoothed.
The HF roll-offs are far too steep.
Another sign of how much work we still have to do is the impulse response is EVIL Linear Phase.
Can you tell us how you generated your sweeps? It would save this beach bum a lot of work.
Thanks for this George but I don't think these posts bears on what we are trying to do.Please see the similar case with difference in analysis method we had in the past.
Read all the posts btn #262 and #287 (see link below).
Especially the remark of Scott that it is not possible to synchronise anything to a signal with random phase (which applies also to a vinyl recording as phase is much more random than ordered with vinyl playback at the sampling level)
#262
http://www.diyaudio.com/forums/analogue-source/298896-digitizing-vinyl-27.html#post4913272
#287
http://www.diyaudio.com/forums/analogue-source/298896-digitizing-vinyl-29.html#post4917588
You don't have to 'synchronize' the signal perfectly .. only enough so it stays within the bandwidth of the 'swept matched filter'
I know a lot about this cos I arrived at the same method as Angelo but from considering how to easily do swept matched filters. In effect, Pano is exploring how 'synchronized' we need to be.
You do need to 'synchronize' if you want an EXACT impulse response but even then there are dirty tricks you can pull .. if the end result is digital EQ. eg you can assume Min. Phase. [deleted 2 pgs of rant to pre-empt lucky 🙂 ]
____________
I can see an end in sight .. that doesn't rely of some beach bum doing serious work this Millenium 😀
Tried that, 18.504 seconds, for example. Didn't work. 21 seconds seems to work best.To take full advantage of Angelo's method, your 'computer generated sweep' needs to EXACTLY the same as the original.
The sweeps were generated using HOLM, at 18 secs or 21 secs, no in-between choices. Also used a wave editor to generate a sweep of the exact same length as the vinyl sweep. Problem is, the editor makes a linear sweep, not log.
It's quirky, but I'll keep trying.
Well no, the aim is to analyse George's sweep files for differences in frequency response amounting to about 1dB, so as to verify or debunk a claim you made as to F response changing after 24hours relaxation, Richard. IIRC.In case anyone forgets, the aim of the exercise is to get better measurements of the frequency response of a cartridge.
However, the files at face value indicate no such difference, probably because there is no meaningful difference, as confirmed by simple checks and balances.
Nevertheless, rather than accept the obvious, focus is shifted to analysis in pursuit of a method that might show a difference. However the risk to the proper aim is twofold a) that analysis becomes so complex as to be unverifiable as to error or accuracy by the mortal man, then any result can't be verified should it contradict checks and balances b) pursuit of the analysis becomes an aim in itself, which is about where we are IMO.
Don't get me wrong, I think such short sweep analysis has enormous potential and warrants a separate discussion that doesn't obfuscate this thread, unless that is an aim in itself ?
LD
lucky, it's pretty obvious from your posts here and in other forums that your aim is to debunk old knowledge and substitute it with your Holy Book .. whether these have any validity or not.Well no, the aim is to analyse George's sweep files for differences in frequency response amounting to about 1dB, so as to verify or debunk a claim you made as to F response changing after 24hours relaxation, Richard. IIRC.
However, the files at face value indicate no such difference, probably because there is no meaningful difference, as confirmed by simple checks and balances.
I'm not really interested in proving to da deniers that the world was not made in 6 days. For the point on which you pontificate ad nauseum, this has NO practical benefit to man or beast so I don't intend to cross swords with you ever again.
If you wish to hijack this thread to for your own ego, be my guest ... but how about not stifling progress on other matters .. After all, you claim it couldn't possibly ruin your pet hobby horse 😱
But in the meantime, you might wish to re-visit FFT 101.Secondly, run a very short FFT, trading frequency resolution for noise and artefact reduction. Reasonably spanning the 10kHz spot section. Difference I obtain is c 0.04dB@10kHz +/- 0.06dB .........
There are several articles in da B&K journals that explain simply & clearly, the relationship betweem FFT size, noise & artifacts. I'm sure Klippel will have similar on his huge & comprehensive website .. and there's the TDS people too.
Bill, this is your thread. I posted here instead of the Digitising vinyl thread cos George posted his curves here. I've done and am still doing a lot of work on making sense of these curves cos I though it would be of practical benefit to you & George.
If you don't want it here, I'll gladly leave it to lucky and his mythical model.
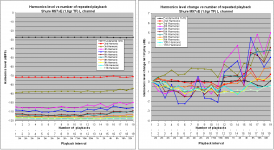
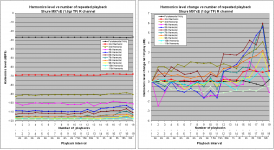
Thank you very much for doing this, George, and to such a high standard of method and care. They are just great, and allow all sorts of mining and exploration.The third and last test run.
Though I've been quiet, I've spent considerable time looking at your 2nd test run files, for the 2.5g 300Hz tests. I haven't finished by any means, but thought I'd post an interesting observation, as a teaser.
Significant variation in 3rd harmonic distortion (8dB variation) is well correlated with the progressive number of tests performed. Correlation coefficient 0.94, very strong.
See attached chart, including a correlation inset.
LF stability is similarly correlated, coefficient 0.87. The cross-correlation between LF stability ranking and 3rd harmonic distortion ranking is 0.79, also strong.
Interesting ?
LD
Attachments
Last edited:
Good Grief George, that's a lot of work!
Thank you Michael.
It was a lot of work, yes. And I failed to notice the 3rd harmonic was missing from one of the diagrams I posted.
I repost the diagrams corrected here.
George
Attachments
Thanks George. These are for your 1.6g test run, and seem not to show the same correlation I noted for the 2.5g test. But the format is different to mine, so can't be sure.It was a lot of work, yes. And I failed to notice the 3rd harmonic was missing from one of the diagrams I posted.
I repost the diagrams corrected here.
George
LD
Warning. They are for the 1.6gr VTF alright but not from Stanton reading the 300Hz track.
It's from the Shure M97xE reading (at 1.6gr TF) another track (1kHz tone) from another test LP, refer to post #1019
George
It's from the Shure M97xE reading (at 1.6gr TF) another track (1kHz tone) from another test LP, refer to post #1019
George
lucky, it's pretty obvious from
Ricardo no.

Lucky is as technical and helpful as it gets. So it’s you.
Technical arguments are very welcome here. Please don’t let egos and personalities blur the scene.
this has NO practical benefit to man or beast
This is a personal opinion and IMHO is also premature.
If you wish to hijack this thread
No. Cantilever flexing is right in the middle of thread’s interests
but how about not stifling progress on other matters
There are two other matters running concurrently here (both are less in line with the thread’s title but they are relevant).
One is the subject you raised about the repeatability capabilities of vinyl as a medium and it’s recovery behaviour.
I just finished doing some tests on this using what I have. I hope you will download the latest files see post #1019 (there will be available for two more days) to do your own analysis taking your time.
The other is pitfalls of FFT and it is equally applicable to the Digitising Vinyl thread.
But this:
Is to be addressed to me, not to Lucky. It’s me that I have made my mind based on shaky understanding of the FFT issues.But in the meantime, you might wish to re-visit FFT 101.
There are several articles in da B&K journals that explain simply & clearly, the relationship betweem FFT size, noise & artifacts.
I've done and am still doing a lot of work on making sense of these curves cos I though it would be of practical benefit
It is and I thank you for that.
George
George, once again you completely embarass me for my lack of progress. Thank you so much for your hard work on this.
I had a Audio Technica Cartridge with carbon fiber cantilever. Do they have any advantages over flexing ?
Regards.
Regards.
Though I've been quiet
Thank you Lucky.
May I ask you what you do to calculate correlation coefficient?
And what you mean by LF stability?
George
Thanks for the last few posts. I was trying so hard to get a clean graph of the vinyl sweeps that I lost track of the subject matter. Basically the Stanton and Shure are flat within the majority of the audio band. Enough said. Watching the harmonics as the track plays is interesting, it mimics George's graphs.
What is facinating is the last round of playback graphs from George. Do these show groove wear in the form of increased distortion, or is it something else?
What is facinating is the last round of playback graphs from George. Do these show groove wear in the form of increased distortion, or is it something else?
Enough said.
Next week there will be another round of dealing with freq sweeps😉
the last round of playback graphs from George. Do these show groove wear in the form of increased distortion, or is it something else?
I hesitate to discuss it based only on the graphs I posted.
There is a lot of data in these files and there are probably more than one way to say what is going on.
Besides the questions of vinyl wear and recovery are practically important.
Give it some more time Michael. 🙂
George
- Home
- Source & Line
- Analogue Source
- mechanical resonance in MMs


