For sure. And thanks for your kind words a few posts back.Thank you Lucky.
May I ask you what you do to calculate correlation coefficient?
And what you mean by LF stability?
George
There's an excel function CORRELL(array1, array2) which returns the correlation coefficient of two arrays.
For the 2.5g test files, I noticed significant variation in some parameters, such as 3rd harmonic distortion, across the 16 posted files. 8dB or so is the range across 16 files, IIRC, and fairly evenly distributed.
Wishing to see if distribution is random, I ordered test files by value of 3rd harmonic distortion, and assigned a rank to each file. So the test file with the highest 3rd harmonic distortion was ranked 1, the next highest ranked 2 etc etc Then I used excel to correlate the rank with the time order of the files.
There's an excellent correlation, 0.94, which means there's almost certainly a real relationship between 3rd harmonic distortion and the progressive time order of the test.
I did the same for LF stability, by examining amplitude of the cart-arm resonance, and noted a similar strong correlation, 0.87 IIRC, suggesting a real relationship between cart-arm resonant amplitude and progressive time order of the test.
Then I cross-correlated 3rd harmonic distortion and LF stability, which also strongly correlated (0.79 IIRC), again suggesting a link.
There is a big difference between cause and correlation, of course.......and the direction of correlation is that 3rd harmonic distortion reduced with progressive time order of the test.
HTH !
LD
Last edited:
Thanks Lucky.
Well if the data from the three runs I have gathered for plotting the diagrams are of any use, here they are:
https://www.dropbox.com/s/78fr0rivufcayxo/300Hz%20harmonics%20Stanton%20MKVD5.xls?dl=0
https://www.dropbox.com/s/1f0vi7y8toy77fo/1kHz%20harmonics%20Shure%20M97xE.xls?dl=0
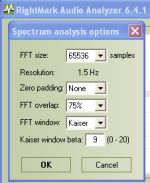
Enlisted are the peaks as I read them by using FFT with the settings as in the attachment.
George
Attachments
🙂 statistics 🙂
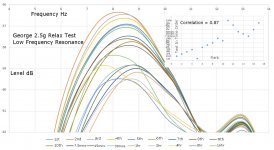
Here's the LF resonance chart for all 18 files, inc a correlation inset. 0.87 is the coefficient. The cart-resonant system generally became more stable with progressive tests.
George's 2.5g tests. Thought best to post some of these, to clear the backlog.......!
LD
Here's the LF resonance chart for all 18 files, inc a correlation inset. 0.87 is the coefficient. The cart-resonant system generally became more stable with progressive tests.
George's 2.5g tests. Thought best to post some of these, to clear the backlog.......!
LD
Attachments
Last edited:
Lucky can you show this in two diagrams please?
One with the data from the consecutive 1 to 10 plays, the other from the delayed 11 to 18
I can't see what line is which 😱
George
One with the data from the consecutive 1 to 10 plays, the other from the delayed 11 to 18
I can't see what line is which 😱
George
The previous .wav file that I made available in #1010, was at 96 kHz 24 bits
Not completely happy with the results, I produced this 192 Khz 24 bits .wav file.
https://www.dropbox.com/s/hebh9hr4oxegh68/chirp_192.wav?dl=0
At least played in LTSpice, results are looking favourable, see spectrum below of 4Meg FFT, no windowing, no sin(x)/x correction
Hans
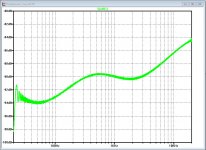
Not completely happy with the results, I produced this 192 Khz 24 bits .wav file.
https://www.dropbox.com/s/hebh9hr4oxegh68/chirp_192.wav?dl=0
At least played in LTSpice, results are looking favourable, see spectrum below of 4Meg FFT, no windowing, no sin(x)/x correction
Hans

Last edited:
Sure.Lucky can you show this in two diagrams please?
One with the data from the consecutive 1 to 10 plays, the other from the delayed 11 to 18
I can't see what line is which 😱
George
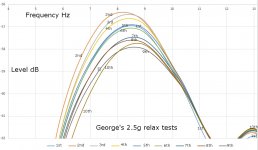
Here's tests 1st - 10th, the back-back repeats. Time delay set to follow.
Interesting ?
LD
Attachments
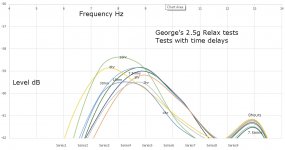
Here's tests 11 - 18, the time delayed tests.
Very interestingly, whereas the back-back tests correlate strongly, this section of the data doesn't: -0.28 coefficient.
It perhaps looks like rests up to a few hours moved in one direction, then longer delays in the other........
I would say that the back-back tests (post above) and the time delay test portions (below) very probably behaved differently.
Interesting still very, yoda thinks.
LD
Attachments
Last edited:
Interesting ?
Very. Except the first, all line up perfectly.
Check if both channels show such a behavior.
George
I noticed something strange in the Shure M97 delayed files, the after the 2 hours delay but I won't interfere now.
Lucky just keep on searching and keep notes.🙂
George
Lucky just keep on searching and keep notes.🙂
George
Not completely happy with
Hans I am about to look on your files.
It's time to face my demons 😀
George
The 1st test is unique in those back-back tests, because it is the only one that has no immediately previous play history 🙂Except the first, all line up perfectly.
LD
Seems odd above 18Khz, but that may be an artifact.
Pano, I'm trying to get to grips with HolmImpulse and like anyone who has done similar software, am finding it very frustrating.I realized that the FR plots I posted are inverted. That's because I was using the vinyl sweeps as the reference, and comparing a perfect sweep to them. So I had to flip the response. See below, as these seem a lot more believable. Still not sure about what's going on circa 30Hz.
BTW, these are 1/12th octave smoothed.
Some progress but its slow.
Are you generating a log sweep with HolmImpulse and exporting it as a WAV?
How are you doing the 'software RIAA'? Hans Polak, the same question to you too.
The huge rise at HF may simply be due to 'frequency response smoothing'
BTW, George, as the HFN sweep supposedly has 'nothing' above 20kHz, there is nothing to be gained with 96kHz sampling compared to 48kHz. It not only doubles the size of the files but also many programmes including HolmImpulse can't do 2M FFTs.
I'll write more next week when I can do a bit more work on this.
Last edited:
George, I was commenting on lucky's statement.Is to be addressed to me, not to Lucky. It’s me that I have made my mind based on shaky understanding of the FFT issues.
It is so wrong that I was just going to ignore it as I'd vowed not to rise to his denial bait unless I could say something that would be useful to others.
Mea culpa, mea culpa, mea maxima culpa.
You, like me and most others on this thread, are ready & willing to learn, and I like to think we have all learnt a lot .. about FFTs as well as other stuff. 🙂
Most of us here are either trying to learn something new or contribute to the store of universal knowledge. That's why I'm always asking questions .. like whether lucky models the effect of da bung on the 'first HF resonance' 😀
Of course pretty much all of my small contribution to this thread has only been possible cos your hard work .. for which I'm truly grateful
________________
George, I think the #1010 WAVs are all single frequency to look at THD. Is that right?
I've downloaded a few but its hard enough work doing the frequency response stuff for which I think I'm better qualified.
Last edited:
For the avoidance of doubt, none of my posts are bait, I have no animus and no agenda. If anyone disagrees with technical content or interpretation, please argue the point rather than attack the person. Which I believe is proper forum protocol.
Somewhere on this thread Bill mentioned that exploring long held common-knowledge seems bound to be unpopular to an extent. But I like Scott's signature along the lines it matters what is right rather than who is right, and how else is one supposed to test what is true and what isn't in the raft of lore and legend that surrounds vinyl playback?
And, I suspect we could even learn a few things from each other, Richard.....
LD
Yes, HOLM has that feature built in, to save the test signal as a wav file. Just the click of a button.Are you generating a log sweep with HolmImpulse and exporting it as a WAV?
Yes, in Goldwave. It may not be the most acurate, to a fraction of the dB, but I can't be bothered right now to use Scott Wurcer's impulse file. 🙂How are you doing the 'software RIAA'? Hans Polak, the same question to you too.
Likely not a rise. My charts were upside down. See new charts.The huge rise at HF may simply be due to 'frequency response smoothing'
Actually, there is. Harmonics get pretty strong near the end of the sweep and they go right on up to 48Khz with vigor. I believe that's why we see a rise after 20K. It's all harmonics up there, no fundamental to compare to. Just a guess.BTW, George, as the HFN sweep supposedly has 'nothing' above 20kHz, there is nothing to be gained with 96kHz sampling compared to 48kHz.
This is true. And harmonics might well be interesting as markers for effects we are exploring.Harmonics get pretty strong near the end of the sweep and they go right on up to 48Khz with vigor. I believe that's why we see a rise after 20K. It's all harmonics up there, no fundamental to compare to. Just a guess.
LD
If that is the case, your sweep will have started at 20Hz (if you specifed this) but gone all the way up to Nyquist.Yes, HOLM has that feature built in, to save the test signal as a wav file.
I tried this and also a log sweep done in Audacity from 20Hz - 20kHz. There are interesting consequences.
Does anyone know if Goldwave RIAA is Minimum Phase? I suspect it is (truly EVIL) Linear Phase. 😱Yes, in Goldwave. It may not be the most acurate, to a fraction of the dB, but I can't be bothered right now to use Scott Wurcer's impulse file. 🙂
Hans Polak, how did you apply your RIAA pre-emphasis to your log sweep?
BTW, George, as the HFN sweep supposedly has 'nothing' above 20kHz, there is nothing to be gained with 96kHz sampling compared to 48kHz.
You are right but this isn't helpful if we are after Frequency Response.Actually, there is. Harmonics get pretty strong near the end of the sweep and they go right on up to 48Khz with vigor. I believe that's why we see a rise after 20K. It's all harmonics up there, no fundamental to compare to.
Alas, the Pano method isn't truly Angelo's method ... 😡 ... but more like what I started to try to do circa 1990 .. a swept filter.
Angelo's method requires EXACT knowledge of the original sweep. It would give you the Impulse Response (& hence the Frequency Response including Phase) of ONLY the fundamental ..
AND
.. as many harmonics as you like up to Nyquist in the theoretically shortest possible time ...
______________
I think I've got some sense at last on George's #853 & #942 measurements .. but I gotta re-visit FFT 101 (& 102, 103 ... 😀 ) before I report my findings .. and there are several beach bum issues I have to deal with next week ..
Last edited:
Rather than "argue technical content", a scientist would devise a repeatable (one that many people can carry out) experiment, the result of which would decide which view was closer to the truth.If anyone disagrees with technical content or interpretation, please argue the point rather than attack the person. Which I believe is proper forum protocol.
I've suggested an experiment that addresses plastic deformation on vinyl playback.
Also another on the effect of the bung on 1st HF resonance.
Both of these experiments I claim to have done in Jurassic times .. but the important point isn't whether my memory is wonky ... but that a scientific experiment is repeatable. Hence it is possible for someone to confirm the wonkiness or otherwise of my memory. 🙂
lucky, your contention is that little or no vinyl deformation takes place on playback. While you accept the vinyl/tip interface provides damping, you claim it does not introduce a significant "stiffness" element to the complex moving assembly which includes wobbly cantilevers etc.
Would you like to dream up a repeatable experiment (ie one that some follower of this thread can carry out) .. that would check for elastic deformation in a simple conclusive manner.
_______________
An engineer might sometimes devise & carry out such experiments but ONLY if the result is of use to man or beast 😀
Mea culpa, mea culpa, mea maxima culpa .. cos IMHO, only one of the above three experiments meets this criteria. 😱
Last edited:
Hi RicardoGeorge, I think the #1010 WAVs are all single frequency to look at THD. Is that right?
I've downloaded a few but its hard enough work doing the frequency response stuff for which I think I'm better qualified.
Post #1010 is Hans post.
Mine is post #1019. There you’ll find single frequency 1kHz recordings.
They are not for checking frequency response, rather to check the behavior of vinyl under repeated playbacks (play 1 to 10) and the recovery behavior under progressively delayed replays (play 11 to 19).
Download them all or none.
Ricardo, have faith in people (united we stand, divided we fall).
And it’s more internally rewarding
https://www.youtube.com/watch?v=lRyN7muczX4
George
- Home
- Source & Line
- Analogue Source
- mechanical resonance in MMs
