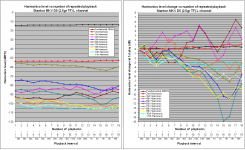
Stanton MKV D5 cartridge at 1.6gram tracking force on Kenwood KD-3100 turntable, to Hagerman Bugle RIAA pre, to M-Audio Audiophile USB card. 24bit/96KHz recordings.
I exercised the cartridge by playing for 20 minutes a music vinyl LP (Lightning Hopkins).
Then I played Side 1 Band 6 (300Hz at +12dB ) from HFN Test LP for ten consecutive times. Repetition interval 30 seconds.
Then, I played the same track after 22 hours.(again I had exercised the cartridge by playing for 20 minutes the same music vinyl LP).
23.1d Celcius ambient temp for 1 to 10 plays.
23.9d Celcius for the play 22 hours later.
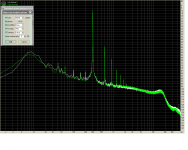
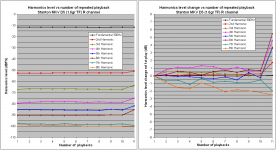
I used FFT (65536 samples and a lot of zoom-in) to read the peaks from the 300Hz and it’s harmonics on each recording. I entered the data in excel and plotted these diagrams.
Playback No 1 to 10 refers to the consecutive every 30 seconds playbacks.
Playback No 11 refers to the playback 22 hours later.
As there is some appreciable difference btn the two channels, I was curious about the influence of tracking weight on the results, so I am in the process of doing the same test, this time with 2.5gram tracking force.
(recommended tracking weight range for this cartridge is 1.5gr to 2.5gr).
George
I exercised the cartridge by playing for 20 minutes a music vinyl LP (Lightning Hopkins).
Then I played Side 1 Band 6 (300Hz at +12dB ) from HFN Test LP for ten consecutive times. Repetition interval 30 seconds.
Then, I played the same track after 22 hours.(again I had exercised the cartridge by playing for 20 minutes the same music vinyl LP).
23.1d Celcius ambient temp for 1 to 10 plays.
23.9d Celcius for the play 22 hours later.
I used FFT (65536 samples and a lot of zoom-in) to read the peaks from the 300Hz and it’s harmonics on each recording. I entered the data in excel and plotted these diagrams.
Playback No 1 to 10 refers to the consecutive every 30 seconds playbacks.
Playback No 11 refers to the playback 22 hours later.
As there is some appreciable difference btn the two channels, I was curious about the influence of tracking weight on the results, so I am in the process of doing the same test, this time with 2.5gram tracking force.
(recommended tracking weight range for this cartridge is 1.5gr to 2.5gr).
George
Attachments

Thank you, George.As there is some appreciable difference btn the two channels,
Unfortunately, the difference extends to subsonics and specifically the cart-arm resonant system........ which suggests there is probably something odd going on, most likely different centering.........
If you are to repeat the test George, would you please standardise on spindle centering so as to normalise weird effects ? Your other files didn't show this..... perhaps by chance.......
Also, if you are willing, please go large on VTF for the test, perhaps 3.5g...?
And, would you kindly post the wav files from that last test, if possible? Thx again.
LD
Here's an interesting puzzle question type discussion about the wear shape of a hard sphere sliding on a surface. What do we all think ?
LD
Not sure but I remember a huge body of empirical folk knowledge around grinding telescope mirrors and when to flip the tool and blank, etc.
And, would you kindly post the wav files from that last test, if possible? Thx again.
LD
You are welcome. Here they are (Stanton , 1.6gr VTF, 300Hz recordings).
They will be there only for 2 days.
1st
https://www.dropbox.com/s/u2y699zpy5dxw4q/1st.wav?dl=0
2nd
https://www.dropbox.com/s/ol332r4kngcmfml/2nd.wav?dl=0
3rd
https://www.dropbox.com/s/j7u8sdf41es2d1j/3rd.wav?dl=0
4th
https://www.dropbox.com/s/kcro4zjlturkfh4/4th.wav?dl=0
5th
https://www.dropbox.com/s/d3d0nplxp220udg/5th.wav?dl=0
6th
https://www.dropbox.com/s/sxzz4stdso5cpsa/6th.wav?dl=0
7th
https://www.dropbox.com/s/wlwerj45rqigtgr/7th.wav?dl=0
8th
https://www.dropbox.com/s/b3wx98tjuzu1r7y/8th.wav?dl=0
9th
https://www.dropbox.com/s/rv3j4evyw666db5/9th.wav?dl=0
10th
https://www.dropbox.com/s/errfbnm1he5cof5/10th.wav?dl=0
after 22 hours
https://www.dropbox.com/s/nfjskpm6xmwr9ur/22h%20later.wav?dl=0
If you are to repeat the test George, would you please standardise on spindle centering so as to normalise weird effects ?
I haven’t moved the record from it’s position. I guess this is what you are asking.
Also, if you are willing, please go large on VTF for the test, perhaps 3.5g...?
No. I charge extra for the heavy weight 😀
(I have already run the test with 2.5gr. Let’s see what will come out of this)
George
Err.rh! Are we on the same planet?It shows the generator pivoting about an intended point only, consistent with a rigid support for a free pivot.
About 40% of the way down the SHURE seminar web page is Fig 7 for which they say ..
"Notice the transducing element has vibrated away from its intended pivot position"
IIRC, the AES paper has even more dramatic pics of pivot shift.
Does your mythical analysis actually include a model of the bung? Despite my sh*t stirring, I'm really quite interested to see if your analysis does more than the SHURE stuff.Which is as I posted, as to how I think support and impedance provided by elastomer suspension for programme material induced motion might work, plus some rotational damping.
If it doesn't include fairly detailed treatment of the bung, it is likely to be very flawed ... evidence to be the experiment (which I've carried out) I've suggested to Bill. 🙂
Last edited:
Where did you get this from George? I take it you meant HFN002HFN 09 Test disk, Side 2 band 7 (full range frequency sweep, 18s long) is a flat track . No RIAA emphasis.
I've got hold of Len Gregory who had HFN02 cut but he says he left details of the sweep to his 'engineer'. I'm trying to get hold of his 'engineer'.
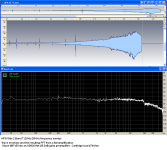
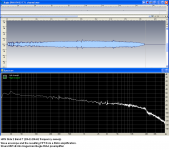
Thanks for this George. I'll try RMAAPics at #873 is from flat amplification.
Pics at #843 is from RIAA amplification.
Both from the same TT/arm/cartridge.
See attachment for the FFT program and settings.
Do the instructions for HFN002 tell you how to do a frequency response sweep with Side 2 Tr 7?
IIRC, the first use of Boron in SOTA cartridges was Technics in their EPC205 (MM) & EPC305 (MC) cartridges .. rather earlier than 1998I have been trying to work out when Boron became the cantilever of choice. Appears to have been around 1998.
These used Boron TUBEs so would meet lucky's approval. I believe EPC205 still has the lowest 'tip mass' achieved in a commercial cartridge.
I've still got one in my sister's shed on the other side of the continent and it is a very fine cartridge.
_______________
The Japanese view 'advanced research' quite differently from us decadent Westerners.
The story I got from a visiting Matsushita bigwig was that ???, did the Direct Drive turntables for Technics and made them a load of $$$.
But his real passion was for cartridges. His 'reward' was to be able to indulge his passion and make 'the best cartridge in the world' with processes & materials unavailable to practically every other cartridge maker ... even though such a small niche market was not even small change for Matsushita. They never promoted their cartridges.
______________
I think all other Boron cantilevers are solid rods so would not meet lucky's approval 😀
Probably not 🙄Err.rh! Are we on the same planet?
About 40% of the way down the SHURE seminar web page is Fig 7 for which they say ....
The article you are reading from was a marketing publication, and the full paper explains it better. But even the marketing article describes that example as 'uncontrolled', ie not operating as intended........
Incidentally, the full paper includes narrative about phase, including a statement that, at 35 kHz for a specific cantilever, motion of the generator end is 180 deg phase delayed relative to that of the stylus. Elsewhere, and perhaps not for the same conditions, at 19kHz the phase delay is 90 deg, it says. This is consistent with my TL predictions, FWIW. IMO, 90 degree phase shift is typically the lowest available resonant mode, the quadrature frequency. Their series, if the simulations are for the same parameters, would begin, 19kHz, 35kHz......... just from cantilever self-resonant motion, and incorporating their idea of vinyl compliance which is (presumably) dominated by cantilever self-flex....... I could buy that.
In case it isn't obvious, the suspension rubber must support the cantilever, and ideally that support isn't compliant for programme material induced motion. IMO, at 10Hz impedance is perhaps 90% spring, at 100Hz perhaps 90% damping, and at 1kHz and above it is effectively entirely damping.
LD
Last edited:
Thank you, once again.I haven’t moved the record from it’s position. I guess this is what you are asking.
Hmm, then wouldn't one expect the 1st and +22hour outcomes to be closely matched, ie the experimental control ?
LD
Where did you get this from George?
I’ve concluded it from the outcome. Look at the attachments 1 & 2. What is your opinion?
I take it you meant HFN002
Yes. It is HFN002. Sorry Ricardo for the confusion
Do the instructions for HFN002 tell you how to do a frequency response sweep with Side 2 Tr 7?
There is no relevant information in the documentation of this test record, see attachment 3
George
Attachments
Hmm, then wouldn't one expect the 1st and +22hour outcomes to be closely matched, ie the experimental control ?
Those diagrams showed that while the 300Hz fundamental remained at the same level btn the 1st playback and +22hour playback, the harmonics haven’t.
I have catered for testing this in more detail on the second round of the test (2.5gr VTF) but I haven’t yet analyzed the results. We’ll see.
George
Don't know if this helps. I remembered that I had a recording of a skipping record, can't get any closer for replay. There was a strong note at bin 50 (36.63Hz) so I extracted the first 5 harmonics from the FFT. The numbers are bin and magnitude of first and second run, BTW the angles are like .01 radian out to the fifth. IMO the differences are clearly noise.
50 - 54.4dB 54.4dB
100 - 58.19dB 58.23dB
150 - 48.32dB 48.36dB
200 - 54.42dB 54.65dB
250 - 28.9dB 28.96dB
50 - 54.4dB 54.4dB
100 - 58.19dB 58.23dB
150 - 48.32dB 48.36dB
200 - 54.42dB 54.65dB
250 - 28.9dB 28.96dB
Thanks Scott
I wish I was like you up to the task of automating data mining from FFTs.
I just finished searching for and writing down the harmonic peaks from 18 stereo recording FFTs (filling a 18x22 table).
And now the easy task. Inputting the data into Excel (2772 keyboard hits 😀)
George
I wish I was like you up to the task of automating data mining from FFTs.
I just finished searching for and writing down the harmonic peaks from 18 stereo recording FFTs (filling a 18x22 table).
And now the easy task. Inputting the data into Excel (2772 keyboard hits 😀)
George
However, a problem lies in differences in the subsonic spectrum, specifically the cart-arm resonance which is a marker for headshell stability. And this affects interpretation.Those diagrams showed that while the 300Hz fundamental remained at the same level btn the 1st playback and +22hour playback, the harmonics haven’t.
The issue is FM modulation of the test tone due to lf headshell instability. This can cause variation of the exact FFT buckets into which the tone and its harmonics are collected. So peak amplitude detection isn't a reliable method for analysing distortion in the presence of variable lf stability. FM causes peaks to spread, and its the area under the curve that matters......the issue is aggravated the finer resolution FFT is run, and is more pronounced for higher harmonics.
I hope I've explained this clearly.........
So I think first one has to look at the (apparently valid) oddities in the lf spectrum and try to work out why they are there in this test, but not the previous one.
I shall have a good look and mine the lf spectrum.
LD
Last edited:
Thanks for this George.I’ve concluded it from the outcome. Look at the attachments 1 & 2. What is your opinion?
The 'wave envelopes' are believable and show the track has RIAA pre-emphasis.
You can
- take the 'wave envelope' and apply a dB scale to the x-axis
- Apply a log frequency 20Hz - 20kHz to the 18 second y-axis
Then you have what a B&K 2307/2305 chart recorder would plot .. just as Dr. Don Barlow would have done. 🙂
- also some 'smoothing' to emulate the Writing Speed of the chart recorders.
But the corresponding FFTs are not.
Were these with a 64K FFT? That's far too small to look at a 1M8 signal with VERY different spectrum at its ends. The max 262.144kHz pt FFT in RMAA 5.5 is still nearly 10x too small.
I'm working on how to look at the WAV files properly this might take some time as I have to figure out how to do a 2M FFT on my abacus. 🙂
The max 262.144kHz pt FFT in RMAA 5.5 is still nearly 10x too small.
I'm working on how to look at the WAV files properly this might take some time as I have to figure out how to do a 2M FFT on my abacus. 🙂
Ricardo, why you mention the limitations of the 5.5?
The 6.4.1 does up to 8.39M
Download. Audio Rightmark
George
On the contrary, if anything that's too big for that test and sample, given what we are trying to examine. IIRC 4096 was used in the 1st test, which seems sensible IMO. The samples are very analysable given standard tools and methods given what we're set to look at, and prevailing conditions. Interpretation is the issue !Were these with a 64K FFT? That's far too small.......
LD
Last edited:
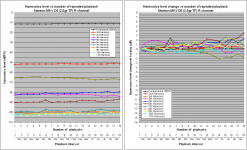
Stanton MKV D5 cartridge at 2.5gram tracking force on Kenwood KD-3100 turntable, to Hagerman Bugle RIAA pre, to M-Audio Audiophile USB card. 24bit/96KHz recordings.
I exercised the cartridge by playing for 15 minutes a music vinyl LP (Lightning Hopkins).
Then I played Side 1 Band 6 (300Hz at +12dB ) from HFN Test LP for ten consecutive times. Repetition interval 30 seconds.
Then, I played the same track after 15min. and progressively doubling the interval time to 30min, 1hour, 2 hours, 4hours, 8hours, 16hours (again exercising the cartridge by playing for 15 minutes the same music vinyl LP).
23.5d Celcius ambient temp for 1 to 10 plays.
23.5 to 224.5 d Celcius for the rest playbacks.
Again I used FFT (65536 samples and a lot of zoom-in) to read the peaks from the 300Hz and it’s harmonics on each recording. I entered the data in excel and plotted these diagrams.
In the 13th playback (the after 30minutes), there is a mysterious glitch at the beginning of the recording for 30secs, which affected the FFT. So, for the diagrams only (*), I dropped the data of the 13th playback and I replaced it with the average of the 12th and the 14th recording.
The difference in behavior btn the left and right channels remains.
But from what I see, I can not say that a pattern emerges, most likely “noise” as Scott wrote.
If I will be tempted by the masochistic lust to repeat the test, I will do it with the Shure M97 cartridge reading a 1KHz track from my other test record (UAT).
I upload the recordings for two days only.
George
(*) the uploaded 13th recording is as captured (with the glitch)
1st
https://www.dropbox.com/s/xdnwzg7qodmkly5/1st.w av?dl=0
2nd
https://www.dropbox.com/s/f78088lfls3yw4y/2nd.wa v?dl=0
3rd
https://www.dropbox.com/s/2lefeqji4btmzws/3rd.wav ?dl=0
4th
https://www.dropbox.com/s/05li3anc4d0r5ly/4th.wav ?dl=0
5th
https://www.dropbox.com/s/aidzlo4ous5f2zy/5th.wav ?dl=0
6th
https://www.dropbox.com/s/8bfw4ak6fvgxehj/6th.wa v?dl=0
7th
https://www.dropbox.com/s/76witpt1njc6v13/7th.wav ?dl=0
8th
https://www.dropbox.com/s/l140eaehsyyhdvp/8th.w av?dl=0
9th
https://www.dropbox.com/s/zvdexvkhrkh5kgu/9th.wa v?dl=0
10th
https://www.dropbox.com/s/xc4wh5znfky3jk1/10th.w av?dl=0
11th 7.5min
https://www.dropbox.com/s/aj22mr0ab5wyjcb/11th% 207.5m.wav?dl=0
12th 15min
https://www.dropbox.com/s/b9h9j7h83drepjy/12th% 2015m.wav?dl=0
13th 30min
https://www.dropbox.com/s/codq5cjj1no1cat/13th%2 030m.wav?dl=0
14th 1hour
https://www.dropbox.com/s/g5pqudgfsqawf5k/14th% 201h.wav?dl=0
15th 2hour
https://www.dropbox.com/s/gx8gtryrkoy9tru/15th%2 02h.wav?dl=0
16th 4hour
https://www.dropbox.com/s/umh2mqsdmulsfqq/16th %204h.wav?dl=0
17th 8hour
https://www.dropbox.com/s/rmy7s30u4qxduyp/17th %208h.wav?dl=0
18th 16hour
https://www.dropbox.com/s/9l605owqtwk79io/18th% 2016h.wav?dl=0
Attachments

Fascinating Shure FAQ answer I just found M97xE laminated pole pieces? | Shure Technical FAQ
Somewhat oversimplified, but an interesting datapoint. I need to go back to George's measurements and see if that matches what they say. Should be able to also see this on OM vs Super-OM (LD you ready to test that yet?).
Edit https://www.vinylengine.com/turntable_forum/viewtopic.php?f=19&t=42945 I see in an unpurged thread my mysterious masked 'guest' has been there before. Would appear that both Shure and Ortofon are both wrong on the physics 🙂
Last edited:
Thanks for this George.Ricardo, why you mention the limitations of the 5.5?
The 6.4.1 does up to 8.39M
Download. Audio Rightmark
I downloaded RMAA6 in 2012 but could never get it to run reliably. This version is MUCH more stable though it still dies unexpectedly at times.
It has the large FFTs you mention. I'm still wary of what it is actually doing.
eg I thought the 'FFT overlap' is 'overlap & save' processing .. a method for small computers to process large files but it isn't.
Similarly with 'Zero padding'. It's not what I thought it was.
- Home
- Source & Line
- Analogue Source
- mechanical resonance in MMs