Patrick, you are in a class all by your self. Stop giving us a bad feeling ;-)
Jan
The case for the Viktor is just a commercial item.
Anyone can get something similar (e.g. YGW-008) :
YGW 008 88*38*118/3.46''x1.49''x4.65''(wxhxl)mm Electric amplifier aluminum enclosure|enclosure electrical|enclosure amplifierenclosure aluminium - AliExpress
😉
Patrick
This one is exactly the one I showed above :
80*45*115 mm (wxhxl) Aluminum equipment extruded cases for electronic|case for|cases for electronicscase case - AliExpress
Patrick
80*45*115 mm (wxhxl) Aluminum equipment extruded cases for electronic|case for|cases for electronicscase case - AliExpress
Patrick
Soldering aside your Autoranger does not look too shabby. I kind of like the "military" appearance.
/Martti
Ouch!
About the look: it is functional.
Jan
It's not what you think Patrick!
BTW Got my 1st shot today, in my right arm. My left arm hurts ;-).
But that will be over next week when they replace the left shoulder Thursday.
Jan
BTW Got my 1st shot today, in my right arm. My left arm hurts ;-).
But that will be over next week when they replace the left shoulder Thursday.
Jan
The positive aspect is that, starting next Monday, I'll have a nice woman coming to wash and dress me each morning. Or a guy; it's a toss-up ;-)
Jan
Jan
I see far, far too many amplifier distortion and/or noise plots where dBfs, dbA, dBR, dBV are used that do not reflect reality. I was sent a plot by a guy with the peak mains component in an amp at -120 dBV and the amp spot noise floor at c. -135 dBV. Both not possible. The power transformers were 3” away from the amp boards and power amps don’t have nV wideband input noise levels. I surmise he ran the amp at full power and got a 0 dBR reading then switched the ref signal off, so the reading was dB wrt to full output.
Might be an idea to start a discussion thread on this stuff and set some ground rules. Some of it is down to misunderstanding, but some of it is . . .
I absolutely agree.
Stein
I'm not sure what that means. It is also important what the graph shows, what the fundamental magnitude is, what the distortion is with respect to the fundamental. That, in the final analysis, is what counts.
Jan
Jan
Jan I do not know if you refer to my post above or wrote in general about the FFT measurements.
This cannot be done automatically with my setup and software. (or do not know how) I can measure the fundamental level and have it in mind. After that to connect a notch, amplify and measure again.
About the noise. I am using Hanning window and 0.7Hz resolution. Hanning has 1.5 * bin resolution of noise eq. The noise in db should be very close to the real values (-180db=1nV/sqrtHz). I measured the notch, that was used for the measurements and it has noise. More in the low frequency region and decreasing in high frequency. Combined with 20db amplifier the noise floor rise to around -140db (100nV/sqrtHz) around 2kHz. That is why i cannot measure anything below.
This cannot be done automatically with my setup and software. (or do not know how)
I can measure the fundamental level and have it in mind. After that to connect a notch, amplify and measure again. About the noise. I am using Hanning window and 0.7Hz resolution. Hanning has 1.5 * bin resolution of noise eq. The noise in db should be very close to the real values (-180db=1nV/sqrtHz). I measured the notch, that was used for the measurements and it has noise. More in the low frequency region and decreasing in high frequency. Combined with 20db amplifier the noise floor rise to around -140db (100nV/sqrtHz) around 2kHz. That is why i cannot measure anything below.
It seems a picture to a private message cannot be attached. Nevermind. 🙂 It is better to share some of the info about the notch here.
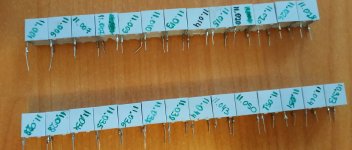
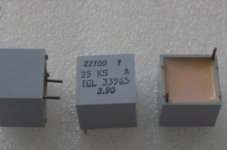
I used old German NOS stock. 1% polystyrene. Like the ones in the mid. picture but 11nF. Measured at 1kHz test frequency on an Agilent 4263B LCR meter. Resistors are 0207 MELF 0.1%. I can upload the exact used cap. and res. values the late evening.
I used old German NOS stock. 1% polystyrene. Like the ones in the mid. picture but 11nF. Measured at 1kHz test frequency on an Agilent 4263B LCR meter. Resistors are 0207 MELF 0.1%. I can upload the exact used cap. and res. values the late evening.
Attachments

Last edited:
Sorry for the picture heavy post.
@Jan
Am I correct in saying it's a relative measurement?
Because that's how I've always performed my own measurements, and I get comparable results to those I see in text books from D. Self etc.
So the way I see it....
Find the lowest THD from your ADC by experimenting with input levels (so this could be 1v RMS for example).
Then try to maintain that level for all measurements, regardless of the input / output levels of the DUT.
There is no need to "fudge" levels in the analyzing software, this will give incorrect results.
THD is a ratio of harmonic(s) compared to the fundamental.
So in the examples I provide here - there is no notch filtering.
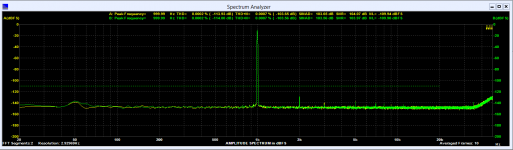
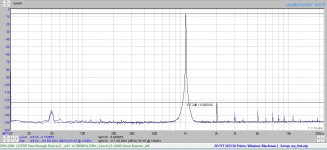
THD is ~0.00018% / THD+N 0.003% (this differs between Virtins Mi and Wavespectra)
Virtins:
2nd harmonic: -132dB = 0.00002%
3rd harmonic: -141dB = 0.000008%
Wavespectra:
2nd harmonic: -123dB = 0.00007%
3rd harmonic: -136dB = 0.000015%
AudioTester:
2nd harmonic: -117.2dB = 0.00014%
3rd harmonic: -129.7dB = 0.00003%
I'm not sure what that means. It is also important what the graph shows, what the fundamental magnitude is, what the distortion is with respect to the fundamental. That, in the final analysis, is what counts.
Jan
@Jan
Am I correct in saying it's a relative measurement?
Because that's how I've always performed my own measurements, and I get comparable results to those I see in text books from D. Self etc.
So the way I see it....
Find the lowest THD from your ADC by experimenting with input levels (so this could be 1v RMS for example).
Then try to maintain that level for all measurements, regardless of the input / output levels of the DUT.
There is no need to "fudge" levels in the analyzing software, this will give incorrect results.
THD is a ratio of harmonic(s) compared to the fundamental.
So in the examples I provide here - there is no notch filtering.
THD is ~0.00018% / THD+N 0.003% (this differs between Virtins Mi and Wavespectra)
Virtins:
2nd harmonic: -132dB = 0.00002%
3rd harmonic: -141dB = 0.000008%
Wavespectra:
2nd harmonic: -123dB = 0.00007%
3rd harmonic: -136dB = 0.000015%
AudioTester:
2nd harmonic: -117.2dB = 0.00014%
3rd harmonic: -129.7dB = 0.00003%
Attachments
Jan I do not know if you refer to my post above or wrote in general about the FFT measurements.
Lets walk through it. Your DUT outputs 1V at the fundamental frequency, right? Then what happens, do you send that through a notch filter? How much does the notch attenuate the fundamental, how much does it attenuate the harmonics? What is its noise level?
Do you know how much the notch itself distorts, is it passive or active?
Then next, what happens, does the output of the notch go to the sound card, or do you use a preamp to boost the level?
Jan
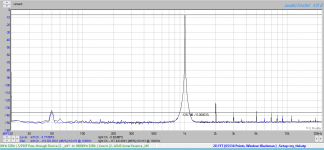
Virtins:
2nd harmonic: -132dB = 0.00002%
3rd harmonic: -141dB = 0.000008%
Wavespectra:
2nd harmonic: -123dB = 0.00007%
3rd harmonic: -136dB = 0.000015%
AudioTester:
2nd harmonic: -117.2dB = 0.00014%
3rd harmonic: -129.7dB = 0.00003%
I am astonished by these differences. I assume this is with the same hardware in each case. Are the FFT settings different?
Without changing anything in the hardware setup, only switching to a different analyzer software, do you get these differences?
Jan
@Jan
I am able to make all measurements simultaneously.
There are some differences in the window function used.
Audiotester: Blackman 65536 points
WaveSpectra: Blackman-Harris7 65536 points
Virtins: Kaiser6 (32768 points - I can't go higher with my version)
Changing the window function to Blackman-Harris in Audiotester gives the same results.
I tried Arta as well: (THD: 0.00021% +N = 0.0023%)
2nd harm: -123.05dB = 0.00007%
3rd harm: -136.58dB = 0.000014
That's identical to WaveSpectra:
Wavespectra:
2nd harmonic: -123dB = 0.00007%
3rd harmonic: -136dB = 0.000015%
ARTA Setup: FFT points: 65536 / Window: Kaiser 7 / Linear averaging (40)
I see the same numbers using a BlackmanH4 window.
Last edited:
Lets walk through it. Your DUT outputs 1V at the fundamental frequency, right? Then what happens, do you send that through a notch filter? How much does the notch attenuate the fundamental, how much does it attenuate the harmonics? What is its noise level?
Do you know how much the notch itself distorts, is it passive or active?
Then next, what happens, does the output of the notch go to the sound card, or do you use a preamp to boost the level?
Jan
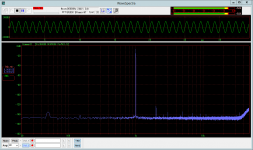
When I make ultra-low distortion measurements I often inject a pilot tone as a reference for a sanity check. If I am working with a 1 kHz fundamental, I may put the pilot tone at about 2.5 kHz. It is a tone from a separate oscillator that I inject in parallel with the main oscillator under test output impedance through a large resistor (like 1 Mohm) that will give me a known "pilot harmonic distortion, usually on the order of 0.001%. This helps me avoid numerical cockpit errors. This approach can also be used to verify frequency-dependent twin T filter losses at different harmonics if a non-compensated twin T is being used. It is always nice to see that reliable pilot tone as a reference as a line in the final FFT.
Cheers,
Bob
- Home
- Design & Build
- Equipment & Tools
- Low-distortion Audio-range Oscillator