REW old
Yes, I've just updated it to the RC7 version, and I have more options now.
I used to feel the same some years ago, but now REW is my favorite and it is constantly evolving and getting better and better.
Your version of REW seems to be a rather old one...
Yes, I've just updated it to the RC7 version, and I have more options now.
Hi Tony,
I made a six-minute long recording (ample for 32 averages in REW) of the output from my Victor oscillator at the level of 2.28Vrms. The recording was made using Cockos Reaper DAW in 24-bit format at a sampling rate of 48kHz, and stored without any conversions in the same format as a .WAV file as a mono recording. No dithering was applied.
You can download the file from my cloud:
https://www.mycloud.ch/s/S00CD7162D533F708158A97868E86DD89E0C9F148C7
I'd be happy if other members would also analyze my data set.
I'm attaching two REW analyses - the first one was made online, and the second one represents an analysis using the recording as the input. In both cases the REW calibration used is the one with the LNA gain accounted for in the calibration. This allows me to read the harmonics' levels directly off the THD table. The "artificial" noise floor that results from the calibration is for me of no concern and I'm not using it as such - the true one was sufficiently documented in my earlier posts.
I used the flat top window this time in order to see whether there are still differences between the THD table values and visual readings. They are present, and I'll post about them in the REW thread.
In addition, I think that a discussion about accounting for the LNA gain in conjunction with a notch filter would also be useful. Calibrating a notch filter alone is straightforward, but I don't see a way to directy calibrate the latter together with a high gain LNA.
Regards,
Braca
If you just use the pilot tone technique I described earlier, that will facilitate the calibration you are talking about and give you a good sanity check as well.
Cheers,
Bob
KSTR,
Thank you very much for your detailed analysis.
The measurements were made with the current version of REW, but I used calibration files from the previous one.
My on-line measurement and the recording lie 18 minutes apart, and the frequency drifted from 998.95 to 999.02 (the oscillator was switched on two hours before the first measurement).
As regards the 7th harmonic, I must take a closer look at it, for it appears with other oscillators as well, and then it is not harmonic. There is enough usual suspects for this crime in my system. In practical terms, it hardly matters at the level displayed.
I'm glad that this work hasn't been "für die Katz"🙂.
Regards,
Braca
Last edited:
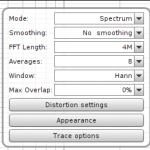
So now I have RC7 version of REW and I can use a 512k FFT length.
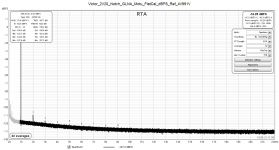
Results of wav upload by Braca
Peak data from 524288-point spectrum using Flat-Top window and no averaging
Distortion at 999.0 Hz, -31.8 dBFS:
THD: 0.0094 % based on 21 harmonics
HHD: 0.0043 % [10 .. 22]
N: 0.60 %
N+D: -78.6 dBFS A
THD+N: 0.60 %
2nd harmonic 0.0028 %
3rd harmonic 0.0037 %
4th harmonic 0.0022 %
5th harmonic 0.0040 %
6th harmonic 0.0035 %
7th harmonic 0.0017 %
8th harmonic 0.0024 %
9th harmonic 0.0029 %
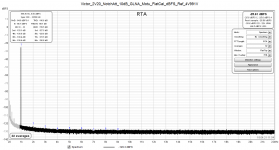
Results of one of my own files:
Peak data from 524288-point spectrum using Flat-Top window and no averaging
Distortion at 1,000.0 Hz, -3.4 dBFS:
THD: 0.00040 % based on 44 harmonics
HHD: 0.00021 % [10 .. 45]
N: 0.0020 %
N+D: -101.0 dBFS A
THD+N: 0.0020 %
2nd harmonic 0.000044 %
3rd harmonic 0.00025 %
4th harmonic 0.000039 %
5th harmonic 0.00015 %
6th harmonic 0.000035 %
7th harmonic 0.00014 %
8th harmonic 0.000024 %
9th harmonic 0.000085 %
I'm not using any special oscillator or even a notch filter.
I'm struggling to see the point of using a notch filter and changing levels from reference?
Results of wav upload by Braca
Peak data from 524288-point spectrum using Flat-Top window and no averaging
Distortion at 999.0 Hz, -31.8 dBFS:
THD: 0.0094 % based on 21 harmonics
HHD: 0.0043 % [10 .. 22]
N: 0.60 %
N+D: -78.6 dBFS A
THD+N: 0.60 %
2nd harmonic 0.0028 %
3rd harmonic 0.0037 %
4th harmonic 0.0022 %
5th harmonic 0.0040 %
6th harmonic 0.0035 %
7th harmonic 0.0017 %
8th harmonic 0.0024 %
9th harmonic 0.0029 %
Results of one of my own files:
Peak data from 524288-point spectrum using Flat-Top window and no averaging
Distortion at 1,000.0 Hz, -3.4 dBFS:
THD: 0.00040 % based on 44 harmonics
HHD: 0.00021 % [10 .. 45]
N: 0.0020 %
N+D: -101.0 dBFS A
THD+N: 0.0020 %
2nd harmonic 0.000044 %
3rd harmonic 0.00025 %
4th harmonic 0.000039 %
5th harmonic 0.00015 %
6th harmonic 0.000035 %
7th harmonic 0.00014 %
8th harmonic 0.000024 %
9th harmonic 0.000085 %
I'm not using any special oscillator or even a notch filter.
I'm struggling to see the point of using a notch filter and changing levels from reference?
Is there a software with more than 130k FFT size? e.g. 512k
The REW beta for linux has maximum FFT 4M, due to raised maximum samplerate to 1,536kHz.
Attachments

Thank you Bob.Bob Cordell said:If you just use the pilot tone technique I described earlier, that will facilitate the calibration you are talking about and give you a good sanity check as well.
Cheers,
Bob
I've seen your recommending this technique several times, and it is also a part of your Distortion Magnifier (nice device, I've assembled one for a colleague).
It'll be a part of my further refining my setup.
Regards,
Braca
Last edited:
I have to correct my assumptions on how REW works. I've made a few tests with artifical files (no measurements), emulating a drifty oscillator with some distortion.
For the dBc base (or fundamental) the rms value is used, not something calculated from the bin levels. So, with a drift the energy is spread, the top of the fundamental stretches across 4..5bin all reading ~ -5dBc in my test case.
The 5th I see then spreads out across some 20 bins and the level reported just happens to be the same than these bin's levels (could be just coincidence), and the "5" marker is dead center (it was a linear sweep from 997Hz to 998Hz).
Any drift could as well be from the recording interface in a real measurement. Probably everything has to fully thermally settle for several hours and must be shielded from any airflow and other disturbance.
Last edited:
If I understand correctly, this relates to measurements without notch filter. If the latter is used, the RMS value of the fundamental is known only at the input to the notch filter (assuming that the distortions represent a second-order effect).
Manually entering its value solves the reference level problem, but the frequency drift remains.
Regards,
Braca
Manually entering its value solves the reference level problem, but the frequency drift remains.
Regards,
Braca
...
I made a six-minute long recording [...] of the output from my Victor oscillator at the level of 2.28Vrms.
...
I'd be happy if other members would also analyze my data set.
...
Regards
Braca
Hi Braca,
According to DiAna the fundamental amplitude seems to be 17.8mV RMS.
Before going any further, I like to know whether this value is correct.
This also should mean that the notch attenuation is 2.28/0.0178=128, right?
Cheers, E.
NB: The current version of DiAna doesn't accept not all wav files due to a known bug (i.e. when the "data" tag isn't terminated by a null character).
I'm using REW with notch filters, too, and normalize the reponse to "flat" by running a sound card calibration. Fundamental and harmonics are displayed correctly and the dBc readings are also correct. Noise floor isn't (in THD+N, etc), obviously.If I understand correctly, this relates to measurements without notch filter. If the latter is used, the RMS value of the fundamental is known only at the input to the notch filter (assuming that the distortions represent a second-order effect).
Manually entering its value solves the reference level problem, but the frequency drift remains.
Regards,
Braca
I've also used the method (explained here) where only the bins around the FFT needles are corrected for notch gain loss, which helps noise readings. This I do by manually editing the calibration file.
OTOH, by this the harmonics of course still can't be any lower than the noise at that frequency, giving the false impression of harmonics sticking out of the noise (in display and measurement) even if that's only noise bins singled out. This can be mitigated by making the mask filter wide enough so that enough noise bins around the real component can be seen.
Hi Edmond,
Spectral peak of -24.31dBFS at 999Hz is referred to the ADC FS, which is 5Vrms, and has thus a value of 0.305Vrms, i.e. 0.305mVrms at the notch filter output.
The notch attenuation of the input signal is thus 20*log(0.305E-3/2.28 = -77.5dB.
For compatibility with my earlier posts, the reference for the harmonics' levels was 5Vrms, thus the units dBFS in the THD box in RTA.
Regards,
Braca
FWIW, I've measured a Viktors 1Khz Oscillator built in 2012 (so, an early revision) and compared it against my SYS2322 (from 1996), squeezing the last bit of resolution (not accuracy) out of the AP.
I've used two signal levels, 2.7Vrms (max on the Viktors) and 500mVrms.
Viktors' Oscillator was powered by a Tek PS503A and was put in a grounded metal case (cookie box).
At 2.7Vrms, the AP's Generator Monitor reads H2: -135dB and H3: -148dB, and some H5 at -150dB.
The Viktors has lower H2: -144dB and higher H3: -138dB. It also has less mains harmonics but a higher noise skirt around the fundamental.
At 500mV, the AP is at H2: -131dB and H3: -136, and again H5: -150dB.
Viktors' Oscillator again has lower H2: -138dB and higher H3: -133dB.
The noise skirt scales with the level change, so this suggests it is a constant noise form the supply (TL431's are noisy down low) and/or the LM4562's modulating the oscillator ever so slightly.
At these levels we never know how much cancelling of harmonics at various places in the chain may or may not be present so those readings sure must be taken with a grain of salt. Higher harmonic levels at lower source levels for both generators doesn't sound correct, after all, so I assume significant cancelling here. One would need to install a LowPass filter á la Pavel Hofman (phofman) to use the phase shift to see if harmonics change as expected or if just the amount of cancelling has changed, giving new "random" levels.
Nonetheless, the performance of either generator is excellent as -130dB should probably be a safe upper limit (-130dB is actually the spec of the AP).
It'll be really interesting to compare Viktors' lastest incarnation (with the OPA1656 and the gain cell placement change) but me thinks noise-wise the TL072's and the supply regs might be dominating... maybe I'll make a copy of it with LT3042/LT3093 supplies...
Attachments
Last edited:
Hi Edmond,
Spectral peak of -24.31dBFS at 999Hz is referred to the ADC FS, which is 5Vrms, and has thus a value of 0.305Vrms, i.e. 0.305mVrms at the notch filter output.
The notch attenuation of the input signal is thus 20*log(0.305E-3/2.28 = -77.5dB.
For compatibility with my earlier posts, the reference for the harmonics' levels was 5Vrms, thus the units dBFS in the THD box in RTA.
Regards,
Braca
The fundamental at -24.31dBFS makes sense: Victor(2.28Vrms)+notch+LNA=-6.8-77.5+60=-24.3
What is confusing is that in your earlier post #9461 in the 4th graph the fundamental was at -37.53dBFS. Why the difference?
Great. Unfortunately Arta only goes up to 130k.The REW beta for linux has maximum FFT 4M, due to raised maximum samplerate to 1,536kHz.
AP in Loopback to test some HD cancelling effects.
Not much going on for H2, but H3 is all over the place depending on exact hookup of the generator to the analyser.
H5 for the higher 3 frequencies is already aliasing, so ignore.
Also, fundamental attenuation varies some 7dB but this is related to the change in test frequency, with the AP notch running counter-tuned. When the notch doesn't null equally I see another 2dB of variation in H2 for the same test condition except for change of frequency.
Bottom line: below 130dB this is just reading tea leaves...
Attachments
I think you could safely say the uncertainty of measurements of harmonics below 120 dB Fundamental is probably +/- 5 dB or more. And probably beyond useful information.
Attached is a plot of my Victor oscillator with a Shibasoku I made in 2018. The Victor is battery powered.
Attached is a plot of my Victor oscillator with a Shibasoku I made in 2018. The Victor is battery powered.
Attachments

The residual level is not the same in all measurements because the notch frequency in my filter is adjustable within a range of ±5Hz. Carefully adjusted, the notch depth can be lower than -100dB.bohrok2610 said:The fundamental at -24.31dBFS makes sense: Victor(2.28Vrms)+notch+LNA=-6.8-77.5+60=-24.3
What is confusing is that in your earlier post #9461 in the 4th graph the fundamental was at -37.53dBFS. Why the difference?
For example, in the first attachment below, the notch depth is -96dB (referred to 2.25V) and the adjustment is almost perfect. The resulting spectral analysis shows a residuum level of -44.09dBFS.
The supression of the fundamental is not critical, so I do not always strive for an absolute minimum - it drifts during the measurement anyway.
Regards,
Braca
Attachments
The residual level is not the same in all measurements because the notch frequency in my filter is adjustable within a range of ±5Hz. Carefully adjusted, the notch depth can be lower than -100dB.
For example, in the first attachment below, the notch depth is -96dB (referred to 2.25V) and the adjustment is almost perfect. The resulting spectral analysis shows a residuum level of -44.09dBFS.
The supression of the fundamental is not critical, so I do not always strive for an absolute minimum - it drifts during the measurement anyway.
Regards,
Braca
Since notch depth of -100dB is not needed for this measurement could you make a set of measurements with the -77.5dB notch (or even -70dB if possible):
1. Victor LDO@2.28Vrms (without notch or LNA)
2. Victor LDO@2.28Vrms + 77.5dB notch
3. Victor LDO@2.28Vrms + 77.5dB notch + 60dB LNA
With these measurements it may be possible to see if there is HD cancellation caused by your notch and LNA.
/Martti
Hi Martti,
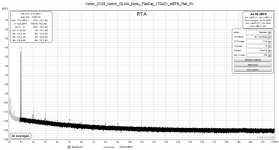
Here are the measurements.
The first att. shows the oscillator spectrum as seen by the Motu ADC. Note the small spikes at the multiples of 508Hz, which have nothing to do with the oscillator.
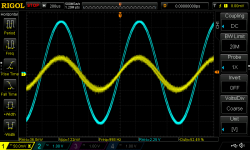
The second spectrum was obtained with the notch filter between the oscillator and the Motu. The fundamental's attenuation was kept at about 70dB. The apparent 2nd harmonic is false (as mentioned above), and represents an internal interference, generated either in the Motu or in the laptop used for the measurements. The same is true of the 8 and 16kHz lines, but here I know that their source is in the laptop. RTA correctly ignores the parasitics, thus practically the same levels of all the distortion harmonics. None visible, though.
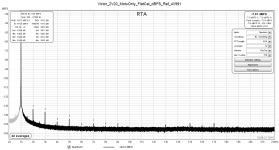
The third spectrum was obtained with the LNA between the notch and the Motu input. The fundamental is off by 1.5dB, but I noticed it too late to correct the notch attenuation and repeat the measurement.
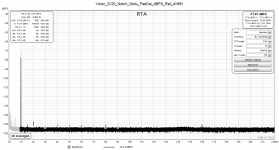
Samuel's design provides for attenuation at the notch input as a "sanity check", and the fourth att. shows a spectrum with the notch input signal attenuated by 10dB. The 2nd is now reduced by 16dB which may indicate cancellation. However, since the oscillator sees a higher impedance when the attenuator is in the circuit (26k vs. 11k) there may be a small effect there as well.
Time permitting, I'll look into this at longer FFTs.
Regards,
Braca
Here are the measurements.
The first att. shows the oscillator spectrum as seen by the Motu ADC. Note the small spikes at the multiples of 508Hz, which have nothing to do with the oscillator.
The second spectrum was obtained with the notch filter between the oscillator and the Motu. The fundamental's attenuation was kept at about 70dB. The apparent 2nd harmonic is false (as mentioned above), and represents an internal interference, generated either in the Motu or in the laptop used for the measurements. The same is true of the 8 and 16kHz lines, but here I know that their source is in the laptop. RTA correctly ignores the parasitics, thus practically the same levels of all the distortion harmonics. None visible, though.
The third spectrum was obtained with the LNA between the notch and the Motu input. The fundamental is off by 1.5dB, but I noticed it too late to correct the notch attenuation and repeat the measurement.
Samuel's design provides for attenuation at the notch input as a "sanity check", and the fourth att. shows a spectrum with the notch input signal attenuated by 10dB. The 2nd is now reduced by 16dB which may indicate cancellation. However, since the oscillator sees a higher impedance when the attenuator is in the circuit (26k vs. 11k) there may be a small effect there as well.
Time permitting, I'll look into this at longer FFTs.
Regards,
Braca
Attachments
- Home
- Design & Build
- Equipment & Tools
- Low-distortion Audio-range Oscillator