I also agree with this proposal - my earlier presentation was suboptimal in this regard.Bonsai said:Might be an idea to start a discussion thread on this stuff and set some ground rules. Some of it is down to misunderstanding, but some of it is . . .
But my main results stand, and I hope to be able to demonstrate the claim now.
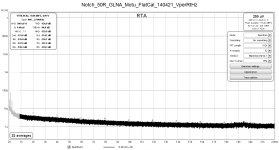
I made a fresh set of measurements with my main measurement chain consisting of a Hall topology adjustable notch filter (design by Groner), 60dB LNA by Groner (Linear Audio Vol. 3) and a modded Motu Audio Express interface with an FS of 5Vrms. All results to be presented were obtained with the same setup and the same FFT parameters.
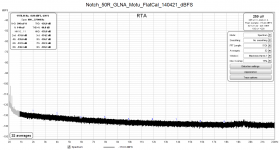
Starting with the notch filter terminated by a 50R resistor at the input, the first plot shows a spectrum obtained at a sampling rate of 48kHz. The noise floor is shown in terms of V/rtHz, but the distortion box shows the "harmonic" values in terms of dBFS. For illustration, the same noise curve is shown in terms of dBFS in the second attachment.
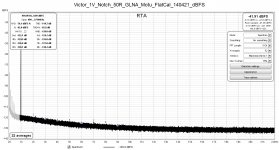
Retaining the "flat calibration" (no LNA and notch filter compensation), shown in the third plot is a spectrum of my oscillator (Victor) at the output level of 1Vrms. The noise floor is now higher, by far most of which being due to the 600 ohm output impedance of the oscillator. No harmonics are visible, but let me remark that the 2nd one is attenuated by 10dB in the filter, and the 3rd one by 4dB.
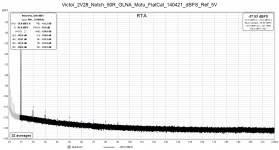
Inreasing the osc. output to its maximum (2.28Vrms in my case), we now see two peaks at -118.5 and -120dBFS, respectively. The question now is what their "true" level is: since all discrete frequencies are amplified by 60dB in the LNA, their respective levels are 115.8 + 10 - 60 = -165.8 and -120 + 4 - 60 = -176 dBFS. These figures include distorsion in the filter, LNA and ADC. Referred to the output level of the oscillator, their respective values are about 7dB higher, i.e. -159 and -172 dBc.
The same values are obtained if the FS value in RTA was manually set to 5mV, this being the apparent range of the ADC with the LNA in front of it. And this is effectively what REW does by lowering the noise floor.
I'm in no position to verify these results by an independent measurement, but values similar to these have been repeatedly quoted in this tread.
It may be worth mentioning that these measurements are possible by virtue of FFT separating noise and discrete frequencies through the FFT processing gain, i.e. the amount by which a noise value is being distributed along the frequency axis, which in the case at hand is more than 54dB.
Hopefully this clears misunderstandings in connection with my previous posts.
Regards,
Braca
Attachments
-
 Notch_50R_GLNA_Motu_FlatCal_140421_VperRtHz.png52.1 KB · Views: 311
 -
 Notch_50R_GLNA_Motu_FlatCal_140421_dBFS.png56.5 KB · Views: 317
 -
 Victor_1V_Notch_50R_GLNA_Motu_FlatCal_140421_dBFS.png57.6 KB · Views: 315
 -
 Victor_2V28_Notch_50R_GLNA_Motu_FlatCal_140421_dBFS_Ref_5V.png50.2 KB · Views: 308
 -
 Victor_2V28_Notch_50R_GLNA_Motu_FlatCal_140421_dBFS_Ref_5mV.png50.3 KB · Views: 316
Last edited:
@DNi (Braca?)
Please can you do me a favour and record the above output to a wav file and upload it here (I think you may need to zip it first).
I would like to analyse it with my setup.
Thanks,
Tony.
Please can you do me a favour and record the above output to a wav file and upload it here (I think you may need to zip it first).
I would like to analyse it with my setup.
Thanks,
Tony.
Technically, I suppose I can do it, but the records could be rather long for 32 averages.
Let me see what can be done.
Braca
Let me see what can be done.
Braca
I also agree with this proposal - my earlier presentation was suboptimal in this regard.
But my main results stand, and I hope to be able to demonstrate the claim now.
I made a fresh set of measurements with my main measurement chain consisting of a Hall topology adjustable notch filter (design by Groner), 60dB LNA by Groner (Linear Audio Vol. 3) and a modded Motu Audio Express interface with an FS of 5Vrms. All results to be presented were obtained with the same setup and the same FFT parameters.
Starting with the notch filter terminated by a 50R resistor at the input, the first plot shows a spectrum obtained at a sampling rate of 48kHz. The noise floor is shown in terms of V/rtHz, but the distortion box shows the "harmonic" values in terms of dBFS. For illustration, the same noise curve is shown in terms of dBFS in the second attachment.
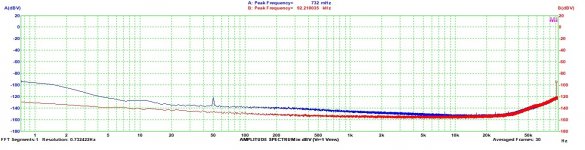
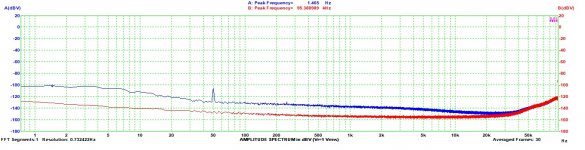
Retaining the "flat calibration" (no LNA and notch filter compensation), shown in the third plot is a spectrum of my oscillator (Victor) at the output level of 1Vrms. The noise floor is now higher, by far most of which being due to the 600 ohm output impedance of the oscillator. No harmonics are visible, but let me remark that the 2nd one is attenuated by 10dB in the filter, and the 3rd one by 4dB.
Inreasing the osc. output to its maximum (2.28Vrms in my case), we now see two peaks at -118.5 and -120dBFS, respectively. The question now is what their "true" level is: since all discrete frequencies are amplified by 60dB in the LNA, their respective levels are 115.8 + 10 - 60 = -165.8 and -120 + 4 - 60 = -176 dBFS. These figures include distorsion in the filter, LNA and ADC. Referred to the output level of the oscillator, their respective values are about 7dB higher, i.e. -159 and -172 dBc.
The same values are obtained if the FS value in RTA was manually set to 5mV, this being the apparent range of the ADC with the LNA in front of it. And this is effectively what REW does by lowering the noise floor.
I'm in no position to verify these results by an independent measurement, but values similar to these have been repeatedly quoted in this tread.
It may be worth mentioning that these measurements are possible by virtue of FFT separating noise and discrete frequencies through the FFT processing gain, i.e. the amount by which a noise value is being distributed along the frequency axis, which in the case at hand is more than 54dB.
Hopefully this clears misunderstandings in connection with my previous posts.
Regards,
Braca
These look reasonable and similar to other measurements of Victor's LDOs. Your first measurement is still a bit misleading since you have not scaled the y-axis according to the 60dB LNA. So actual noise density should be close to 1nV/rtHz. The other thing is that the noise measurement has little to do with the THD measurements. I assume that the 50R in the THD measurement titles is a typo or why would you have a 50R in the chain.
The noisefloor you see on the THD measurements is artificial. Each doubling of the FFT length lowers that "noisefloor" 3dB. But the noise density measurement (V/rtHz) is normalized so FFT length in that should not make a difference. See more e.g. here.
/Martti
Last edited:
Very neat idea to inject a control signal yes 
1nV/rtHz is an extremely low noise. Like 60 ohm resistor.
How can it go so low ? On the setup I use :
- notch shorted and measured.
- notch shorted, amplified 20db and measured.
As mentioned before the setup noise (red curve) around 1-2-3kHz is a bit below 20nV/rtHz. With the notch shorted and amplified 20db the noise goes to -140db - 100nV/rtHz.
Attachments
Last edited:
Yes. The DUT outputs 1V RMS at the fundamental.Lets walk through it. Your DUT outputs 1V at the fundamental frequency, right? Then what happens, do you send that through a notch filter? How much does the notch attenuate the fundamental, how much does it attenuate the harmonics? What is its noise level?
Do you know how much the notch itself distorts, is it passive or active?
Then next, what happens, does the output of the notch go to the sound card, or do you use a preamp to boost the level?
Jan
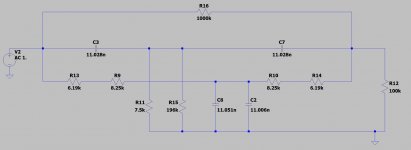
After that 2 x passive notch filters are used in order to keep the setup balanced. The 1kHz notch attenuates 40db or 70 db selectable by a switch. Second harmonic is attenuated 9.7db, third 5.6db. The noise level ... not an easy question. At very low frequencies the resistors are a bit below 30k. A resistor noise calculator from internet gives 22nV/rtHz . But when the frequency increase the impedance decrease. I do not know whether the notch distorts and cannot measure any distortion testing Victor's generator
up to 1.9V RMS. At 2V RMS a tiny third is observed. At 2.1V RMS distortion can be observed. second, third, fifth ... It is low, but visible.
🙂. I wanted to solder and use Jan's notch, but never stole enough time to do it. I went with 2xSE notches instead. But they are not so easy to setup. 2xcables, 2xeverything. And mains noise is picked up right away.I'm currently using a balanced twin-tee notch that is based on Jan's post. That has higher noise than Braca's (measures about 600nV from 22Hz to 22kHz) since the caps are smaller.
BTW it also has almost exactly the same noise in simulation so sometimes simulations are close to reality 😀.
Yes. The DUT outputs 1V RMS at the fundamental.
After that 2 x passive notch filters are used in order to keep the setup balanced. The 1kHz notch attenuates 40db or 70 db selectable by a switch. Second harmonic is attenuated 9.7db, third 5.6db. The noise level ... not an easy question. At very low frequencies the resistors are a bit below 30k. A resistor noise calculator from internet gives 22nV/rtHz . But when the frequency increase the impedance decrease. I do not know whether the notch distorts and cannot measure any distortion testing Victor's generator
up to 1.9V RMS. At 2V RMS a tiny third is observed. At 2.1V RMS distortion can be observed. second, third, fifth ... It is low, but visible.
Your notch in post #9465 has about 820nV noise from 22Hz to 22kHz in simulation. So about 3x more than Braca's.
Thank you for your comment.bohrok2610 said:These look reasonable and similar to other measurements of Victor's LDOs. Your first measurement is still a bit misleading since you have not scaled the y-axis according to the 60dB LNA. So actual noise density should be close to 1nV/rtHz. The other thing is that the noise measurement has little to do with the THD measurements. I assume that the 50R in the THD measurement titles is a typo or why would you have a 50R in the chain.
The noisefloor you see on the THD measurements is artificial. Each doubling of the FFT length lowers that "noisefloor" 3dB. But the noise density measurement (V/rtHz) is normalized so FFT length in that should not make a difference. See more e.g. here.
/Martti
The "50R" in the plot titles applies only to the first two measurements. The rest was a typical copy&paste error. Thank you for spotting it.
As regards the results in my first post, they still stand as regards the harmonics' levels, but I need some time to check the results because I now spotted a possible error in the RTA result for the 3rd harmonic in the fourth plot.
Regards,
Braca
It is not very easy to find 1% capacitors and I used whatever i was able to find. I should look at the local NOS market to see if a bigger capacitance can be obtains.
In fact increasing the FFT size can permit me to go a bit lower, but the measurements will become very very slow. 😡
In fact increasing the FFT size can permit me to go a bit lower, but the measurements will become very very slow. 😡
My filter was built with capacitances of 100nF, each leg consisting of 10 ceramic C0G capacitors of 10nF each in parallel, and then trimmed to below 1% of deviation.
In my case, filter noise is the main contributor to the total noise.
In my case, filter noise is the main contributor to the total noise.
Hi Tony,@DNi (Braca?)
Please can you do me a favour and record the above output to a wav file and upload it here (I think you may need to zip it first).
I would like to analyse it with my setup.
Thanks,
Tony.
I made a six-minute long recording (ample for 32 averages in REW) of the output from my Victor oscillator at the level of 2.28Vrms. The recording was made using Cockos Reaper DAW in 24-bit format at a sampling rate of 48kHz, and stored without any conversions in the same format as a .WAV file as a mono recording. No dithering was applied.
You can download the file from my cloud:
https://www.mycloud.ch/s/S00CD7162D533F708158A97868E86DD89E0C9F148C7
I'd be happy if other members would also analyze my data set.
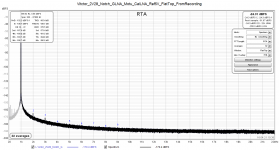
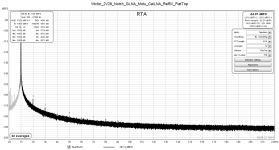
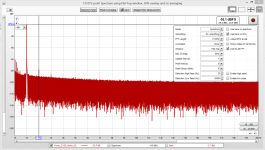
I'm attaching two REW analyses - the first one was made online, and the second one represents an analysis using the recording as the input. In both cases the REW calibration used is the one with the LNA gain accounted for in the calibration. This allows me to read the harmonics' levels directly off the THD table. The "artificial" noise floor that results from the calibration is for me of no concern and I'm not using it as such - the true one was sufficiently documented in my earlier posts.
I used the flat top window this time in order to see whether there are still differences between the THD table values and visual readings. They are present, and I'll post about them in the REW thread.
In addition, I think that a discussion about accounting for the LNA gain in conjunction with a notch filter would also be useful. Calibrating a notch filter alone is straightforward, but I don't see a way to directy calibrate the latter together with a high gain LNA.
Regards,
Braca
Attachments
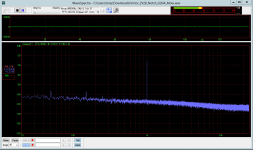
I must confess to being somewhat confused here.
On playback, your file has a fundamental of -32dB with THD of 0.018%
The noise floor is so high that any harmonics are being masked.
Am I missing something?
On playback, your file has a fundamental of -32dB with THD of 0.018%
The noise floor is so high that any harmonics are being masked.
Am I missing something?
Attachments
There is no fundamental of 2.28V in my recording. What you see is the residual at the filter output, amplified by 60dB.
Try using the same parameters I did in my analyis: FFT length of 524k, flat top window (if there is one). My data were recorded with an FS of 5Vrms.
As you can see in my plots, the THD is very low, so a first measure is to lower the noise floor by increasing the FFT length.
A small 2nd harmonic is already discernible in your plot.
Regards,
Braca
Last edited:
Braca,
this is what I see with the latest version of REW (important, as the notch width on the fundamental and harmonics to seperate the HD from the noise floor has been changed to match it to Audio Precision).
In the main plot (in dBc units, absolute dBFS level can be read on the right), we can see that the label for the 3rd harmonic is in the middle of the spectral line, vertically, not above it.
Zooming in shows why, the assumed frequency is off a few bins (freq drift, possibly, which spans N-times the range of bins for the N-th harmonic so it becomes more critical for higher harmonics). On the 7th it's already off significantly.
As far as I know, REW calculates the harmonics as the sum of all bins that are inside the known skirt for a spectral line according to the current window function, but the base frequency is not gathered from the distribution of that harmonic across its bins. Rather, the "center of weight" of the fundamental might have be used. Also the fundamental level for the dBc base value does seem to be the highest bin, not using adjacent bins, which would be slightly inconsitent.
When we look at the H3 plot vs reported level, the assumed skirt still catches most of the distribution and hence the value is higher than the highest bin. For H7, the assumed frequency is off too much so that the dominant part is already attenuated and the reported level in the table now is lower that the highest bin, let alone the summed bins.
So it seems we have found small inconsistencies. With drifty/unsync'd sources, things really get tricky. Maybe John has an idea how to tackle this issue...
Attachments

Last edited:
The FFT length in my version of REW only goes up to 131072 (as does WaveSpectra)
I don't have a lot of knowledge of REW as I confess I have never liked using it.
Using REW as setup according to the screenshot, I see the same thing I see in WaveSpectra.
Additionally, the distortion panel is blank?
I don't have a lot of knowledge of REW as I confess I have never liked using it.
Using REW as setup according to the screenshot, I see the same thing I see in WaveSpectra.
Additionally, the distortion panel is blank?
Attachments
I used to feel the same some years ago, but now REW is my favorite and it is constantly evolving and getting better and better.I don't have a lot of knowledge of REW as I confess I have never liked using it.
Additionally, the distortion panel is blank?
Your version of REW seems to be a rather old one...
The frequency of the fundamental is derived from the centroid of the values within the window spreading span of the peak. That could be shifted if the fundamental peak has strong asymmetry. The power of the fundamental is the total in the octave centred on the fundamental frequency. A frequency value can be injected by using the REW generator, if the generator is playing a sine tone the frequency of that tone will be used (either the entered frequency or the nearest FFT bin centre if the generator is set to FFT locked).As far as I know, REW calculates the harmonics as the sum of all bins that are inside the known skirt for a spectral line according to the current window function, but the base frequency is not gathered from the distribution of that harmonic across its bins. Rather, the "center of weight" of the fundamental might have be used. Also the fundamental level for the dBc base value does seem to be the highest bin, not using adjacent bins, which would be slightly inconsitent.
When we look at the H3 plot vs reported level, the assumed skirt still catches most of the distribution and hence the value is higher than the highest bin. For H7, the assumed frequency is off too much so that the dominant part is already attenuated and the reported level in the table now is lower that the highest bin, let alone the summed bins.
So it seems we have found small inconsistencies. With drifty/unsync'd sources, things really get tricky. Maybe John has an idea how to tackle this issue...
- Home
- Design & Build
- Equipment & Tools
- Low-distortion Audio-range Oscillator