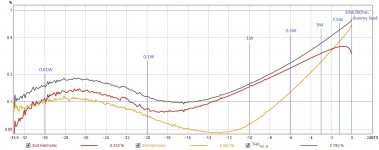
Some measurements showing the distortion profile of my build on 8 Ohm dummy load at discrete power levels ( 0.01W, 0.1W, 1W 2.5W, 5W, 7.5W, 10W)
George
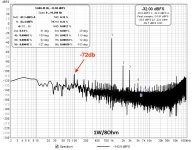
Thank you for sharing this George. I do not have a screenshot on hand but it seems I see the same FFT at 1W, including the peak at 100 Hz (see picture).
I will do more measurements in a couple of weeks but I am just wondering if anyone can explain which one could be the source of such 100 Hz peak with a SMPS PSU.
Attachments
Hi George,
Thank you for making and providing the measurements! Can I ask what you used for the dummy load because that makes a difference. I have tried using wire wound resistors (cement filled, green flame proof, anodized alumuminum case etc) they all had much higher distortion than when I used a bunch of series parallel metal thin film resistors to get the same value at 10w or 25w. The profile also changed. Metal oxide resistors tend to give a higher third harmonic value. The worst one was the "rheostat" style 100w green tubes with flat wire wrapped around the outside. It generated huge distortion and higher order harmonics that were not there with a metal thin film. Another good resistor is a flat thin film power resistor from EBG. They can be heatsinked and seem to produce some of the best measurements.
Also, in the future, can you please change the displayed range of the measurement to say -140 dB to 0dB, and adjust the analyzer input gain so that the signal is about -10dB to -20dB (avoid 0dB as it might clip)? This will give us better resolution when viewing the plots.
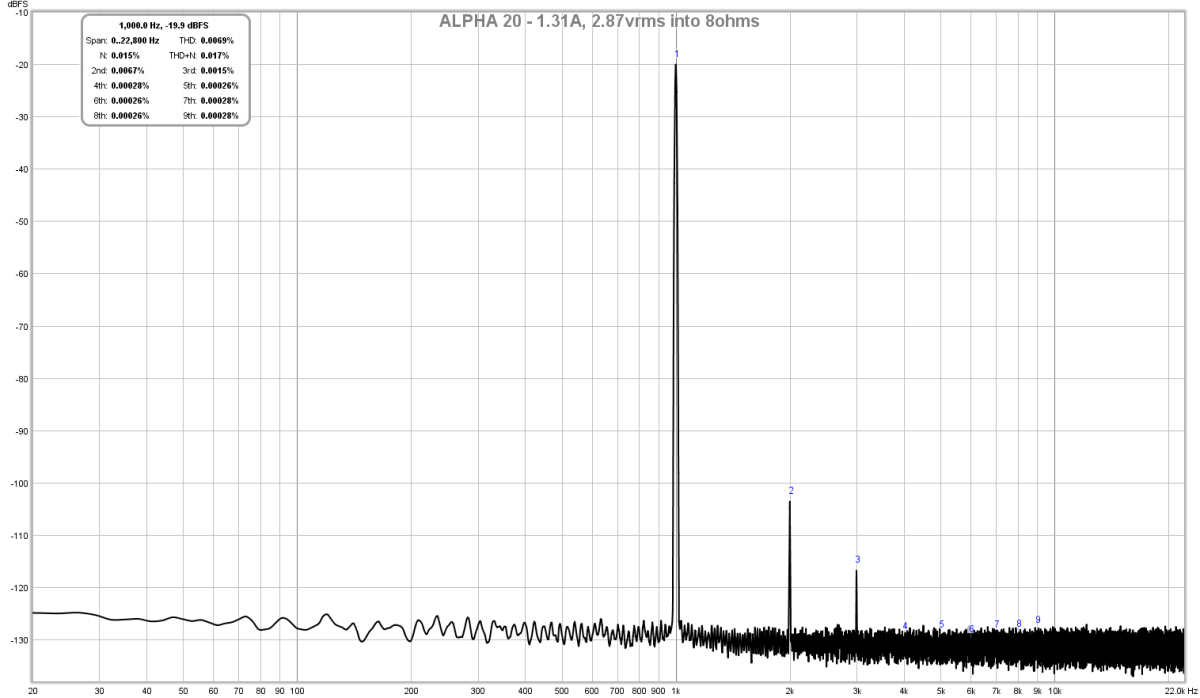
Here is an example from one of my Class A amps running at 2.87vrms into 8ohms with a magnified vertical scale - this lets us see what the variations are on a 5dB scale resolution which is hard to see when the scale is over 250dB vertically:
Thank you for making and providing the measurements! Can I ask what you used for the dummy load because that makes a difference. I have tried using wire wound resistors (cement filled, green flame proof, anodized alumuminum case etc) they all had much higher distortion than when I used a bunch of series parallel metal thin film resistors to get the same value at 10w or 25w. The profile also changed. Metal oxide resistors tend to give a higher third harmonic value. The worst one was the "rheostat" style 100w green tubes with flat wire wrapped around the outside. It generated huge distortion and higher order harmonics that were not there with a metal thin film. Another good resistor is a flat thin film power resistor from EBG. They can be heatsinked and seem to produce some of the best measurements.
Also, in the future, can you please change the displayed range of the measurement to say -140 dB to 0dB, and adjust the analyzer input gain so that the signal is about -10dB to -20dB (avoid 0dB as it might clip)? This will give us better resolution when viewing the plots.
Here is an example from one of my Class A amps running at 2.87vrms into 8ohms with a magnified vertical scale - this lets us see what the variations are on a 5dB scale resolution which is hard to see when the scale is over 250dB vertically:
Last edited:
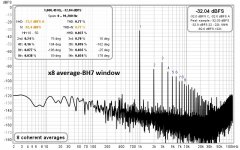
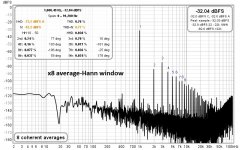
Hi JamesIn the interest of getting FFT measurements that are comparable to others, a Hamming or similar window could be applied, instead of Rectangular.
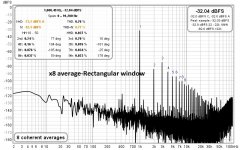
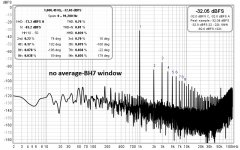
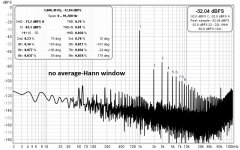
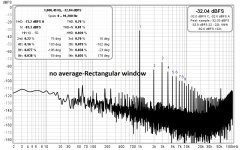
I don’t see any change in the looks of the FFT with windowing change. There is some improvement when applying averaging though, see attachments (all are 10W/8Ohm, 128k FFT length)
Distortion numbers remain the same in any case.
George
Attachments
still at my first morning coffee, so excuse me if I'm taking it wrong that you're still speaking about speaker as testing load........
believe me, I had/have at least dozen even dumber ideas ........ per month
ever tried testing clipping of guitar amp with speaker? or PA amp of few/several hundred watts ?
ppl exactly from these reasons, even if ignore compactness, resorted to using dummy load
besides - Gremlins are there, why replacing dummy speaker every now and then ........
The "reference speaker load" I just meant an amp ref. load consisting of a choke in serial connection with a resistor and then the whole circuit paralleled with a Capacitor.....something like that. I meant not a real speaker......this time ")
Then the 3 components (L,R,C) could be specified by brands so all used the exact same load as reference. Maybe a better speaker equivalent circuit can be "dreamed-up".....
Then the 3 components (L,R,C) could be specified by brands so all used the exact same load as reference. Maybe a better speaker equivalent circuit can be "dreamed-up".....
some of that tackled in Saturday BAF presentations (specifically Demian Martin, New Tools and Techniques for Audio Measurement) , look for them as soon they are at PASS DIY - YouTube
what you're saying is certainly of interest for amplifier manufacturers, while for us mere mortals (less serious), plain reactive dummy load is more than adequate
what you're saying is certainly of interest for amplifier manufacturers, while for us mere mortals (less serious), plain reactive dummy load is more than adequate
Nominal output (continuous) power is specified -at best- at 1% THD.10W/8ohm looks almost like a clipping amp?
At the 10W/8Ohm (nominal power for this amp) FFTs shown before, THD reads 0.76%, H2 0.22%, H3 0.7
Here is a -level increasing- distortion plot (REW RTA-stepped sine measurement, 0.1dB step, 997Hz signal, 256k FFT length, BH7 window, x2 average)
George
Attachments
I am just wondering if anyone can explain which one could be the source of such 100 Hz peak with a SMPS PSU.
Full wave rectification of 50 Hz AC line in switching supply.
An advantage using SMPS should be that there are almost no 50/100 Hz noise?
At least that it my observation.
It is a "bad" SMPS if "much" 100 Hz gets to the output of SMPS?
However it could couple "capacitive" if amp input signal wires goes close to SMPS rectifying circuit? .....so SMPS may not be "bad"......
At least that it my observation.
It is a "bad" SMPS if "much" 100 Hz gets to the output of SMPS?
However it could couple "capacitive" if amp input signal wires goes close to SMPS rectifying circuit? .....so SMPS may not be "bad"......
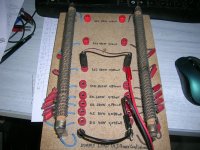
This is the dummy load I use.
For 8 Ohm, I parallel the two 16 Ohm sections.
Long continuous signal testing at 10W does not increase the temperature of the elements more than 2-3 degrees Celcius.
George
Hi George,
I have used these types of dummy loads and unfortunately, they add a lot of distortion. It’s something to do with all the inductance I think.
If you have some 3w metal thin film resistors, connect them as your dummy load at 2.83v (1W) and you will see a difference I believe.
I see! I need to study a bit how SMPS PSU works.
The ones not seeing it in the FFT have just got lucky with a noiseless PSU or done a better job with the wiring?
BTW I am not annoyed by it (90db speakers for now) just curious.
Like all things, there are good ones and bad ones. The best I have used are made by Sami of Micro-Audio. The noise floor is flat as a board from 20Hz to 20kHz down at -130dB. Not even a blip at 60Hz/120Hz/180Hz. The bump I have is from EMI pickup through the air when the SMPS is not even on.
- Home
- Amplifiers
- Pass Labs
- DIY Sony VFET pt 2 (N-Channel Build)