more plots
Attachments
-
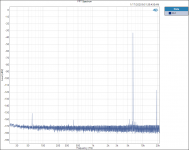
 800 hZ foil 1M 10 ave FFT.PNG49.2 KB · Views: 259
 -
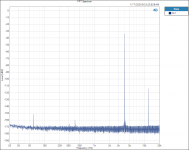
 6300 hZ foil 1M 10 ave FFT.PNG48.8 KB · Views: 104
 -
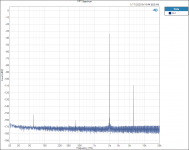
 4000 hZ foil 1M 10 ave FFT.PNG48.6 KB · Views: 95
 -
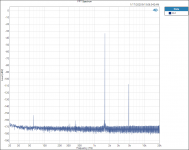
 3150 hZ foil 1M 10 ave FFT.PNG48 KB · Views: 94
 -
 2500 hZ foil 1M 10 ave FFT.PNG47.3 KB · Views: 93
 -
 2000 hZ foil 1M 10 ave FFT.PNG46.5 KB · Views: 255
 -
 1600 hZ foil 1M 10 ave FFT.PNG48 KB · Views: 261
 -
 1250 hZ foil 1M 10 ave FFT.PNG47.1 KB · Views: 266
 -
 1000 hZ foil 1M 10 ave FFT.PNG48.6 KB · Views: 284
DT can you elaborate on the bridge aspect please. Is this a situation where if you had the same model/value of resistor for the DUT and reference arms of the bridge that you would then expect a null type benchmark measurement (assuming there was no subtle environmental differences between each resistor, and the resistor distortion mechanism is intrinsic to the resistor design and not part to part manufacturing variation)?
Resistors are passive and cannot cause distortion. Active components can produce distortion as the incorrect value/impedance is chosen.Your morning shot? Or what do you refer to?
//
Hence snake oil.
Are you for real?Resistors are passive and cannot cause distortion. Active components can produce distortion as the incorrect value/impedance is chosen.
Hence snake oil.
Nonlinearity causes distortion, but you knew that didn't you?Resistors are passive and cannot cause distortion.
DT can you elaborate on the bridge aspect please. Is this a situation where if you had the same model/value of resistor for the DUT and reference arms of the bridge that you would then expect a null type benchmark measurement (assuming there was no subtle environmental differences between each resistor, and the resistor distortion mechanism is intrinsic to the resistor design and not part to part manufacturing variation)?
@trobbins and All,
Take a look at Post 89, there you can see the original test bridge used by Ed Simon.
The test bridge that I used left out the 25 Ohm and 100 Ohm pot at the bottom. I did not want any unaccounted errors slipping in.
For the plot in post 124 I used 10 each PTF65 1K Ohms 0.1% tolerance and 10 ppm TCR. All 10 resistors came directly out of the Mouser bag. My assumption was that all the resistors were pretty much the same. If the match was perfect there would no test signal at 1000hZ on the plot at all.
The assemblies of 4 resistors, in series and parallel, total 1K Ohms. The two groups of 4 resistors are the reference or “benchmark” as you called them.
The other 2 resistors are the Resistors Under Test. Both the Rt on the left and the Rt on the right contribute to the total delta Voltage across the differential output to the Analyzer.
As you see in the plots in post 124 the 3rd Harmonic is well into the FFT noise floor of the FFT with only one average. To put it another way the THD + N is dominated by noise.
Turn up the voltage and or change the Resistor Under Test to CC or to Bulk Foil then the distortion will increase to the level of being the largest contributor.
Snake oil, I do not like the taste of snake oil, however it does have nutritional value. It like fish oil is rich in omega-3 fattyacids.
Thanks DT
Resistors are passive and cannot cause distortion.
That's like saying transformers are passive and can't cause distortion. I'm afraid this statement is wrong.
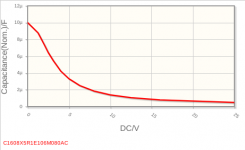
This capacitor is as passive as can be, but I wouldn't call it linear:
C1608X5R1E106M080AC
: Detailed Information | Capacitors - Multilayer Ceramic Chip Capacitors | TDK Product Center
C1608X5R1E106M080AC
: Detailed Information | Capacitors - Multilayer Ceramic Chip Capacitors | TDK Product Center
Attachments
DT, you are indicating that the single resistors in the top and bottom arms are being changed as a pair (eg. post 132 and 147). Are you aiming to use one of those resistors as a reference, and changing the other for comparative DUT testing?
DT, you are indicating that the single resistors in the top and bottom arms are being changed as a pair (eg. post 132 and 147). Are you aiming to use one of those resistors as a reference, and changing the other for comparative DUT testing?
The two single resistors are the Resistors Under Test or Rt. As you call them they are the DUT’s. They are a pair.
There are two “matching” Rt’s in the bridge to maintain the balance of the bridge. The RT’s that make up the pair operate equally but opposite to each other, one in the upper arm of the bridge and the other in the opposite lower arm. The measured distortion is the sum of the distortion in the two Rt’s.
ED Simon used this resistor Wheatstone bridge method to null the test signal, enabling the state of the art audio analyzer to measure distortion levels lower than had been measured before.
Thanks DT
Yeh, just wondering if there is not something being missed by changing two arms, and not just one arm.
I guess the Vishay PTF65 0.1% resistors are not cheap. If they were then it may well be worth doing a cross check using say 9 resistors instead of 4 resistors for each of the two 1kohm balancing arms.
Do you use any thermal sinking or buffering for the bridge resistors, or are they just in free air?
Ciao, Tim
Yeh, just wondering if there is not something being missed by changing two arms, and not just one arm.
I guess the Vishay PTF65 0.1% resistors are not cheap. If they were then it may well be worth doing a cross check using say 9 resistors instead of 4 resistors for each of the two 1kohm balancing arms.
Do you use any thermal sinking or buffering for the bridge resistors, or are they just in free air?
Ciao, Tim
Turns out that I have a Mouser bag here with 100 each PTF65 1K 1% 5 ppm TCR to do just that.
No thermal sinking or buffering for the bridge resistors, they sit under a steel box on a piece of carpet on a concrete slab on grade. The steel box and concrete floor do a decent job of reducing noise.
Thanks DT
Resistors are passive and cannot cause distortion. Active components can produce distortion as the incorrect value/impedance is chosen.
Hence snake oil.
OK. I think you used "snake oil" strangely as that is most often associated with a sold product that carry some magic, unverified, performance. Nothing on sale here just talk about... physics?
//
Hello All,
Tim, I followed up on your thought and replaced the 4 resistor series parallel reference resistors with 9 resistor series parallel 1K Ohm reference resistors.
Retesting the original PTF65 NiChrome thin metal film resistors 9 resistors vs 4 gained only a couple of dBs improvement.
The next step perhaps is to sort the math and get closer to labeling the plots more precisely.
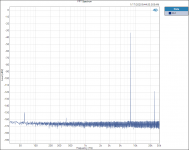
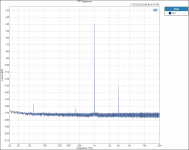
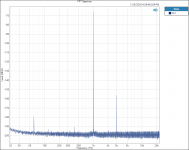
The input voltage to the test bridge is 20 Volts. Because of the bridge null the test voltage plots at -40dBs ish and the 3rd Harmonic plots as -130dBV. 20 Volts input is 26dBV making the dBR -156dBr.
See the attached plots one the scale is dBV, the other is corrected to read dbR. The measured 3rd H is -156dBr relative to the 20 Volts input.
Thanks DT
It is interesting that the test bridge nulls out much of the generator distortion and noise and gives us a glimpse into the inner workings of a couple resistors.
Keep in mind that the levels of distortion measured with the test bridge are most often well below the abilities of the best amplifiers and analyzers.
Thanks DT
Tim, I followed up on your thought and replaced the 4 resistor series parallel reference resistors with 9 resistor series parallel 1K Ohm reference resistors.
Retesting the original PTF65 NiChrome thin metal film resistors 9 resistors vs 4 gained only a couple of dBs improvement.
The next step perhaps is to sort the math and get closer to labeling the plots more precisely.
The input voltage to the test bridge is 20 Volts. Because of the bridge null the test voltage plots at -40dBs ish and the 3rd Harmonic plots as -130dBV. 20 Volts input is 26dBV making the dBR -156dBr.
See the attached plots one the scale is dBV, the other is corrected to read dbR. The measured 3rd H is -156dBr relative to the 20 Volts input.
Thanks DT
It is interesting that the test bridge nulls out much of the generator distortion and noise and gives us a glimpse into the inner workings of a couple resistors.
Keep in mind that the levels of distortion measured with the test bridge are most often well below the abilities of the best amplifiers and analyzers.
Thanks DT
Attachments
Resistors surely do distort but mechanisms not well understood.
Intentional asymmetry using zinc and other materials is well known but carbon and metal film not so much.
I'll throw out a crazy idea that possibly is a memory effect, hidden variables not yet fully understood.
You could perhaps run a Markov style simulation through the physical properties (including thermal change).
Thanx DT. Like any new test jig and measurement scheme, it can be well worth 'playing around' with setups to get some confidence that results are as expected and nothing untoward is lurking in the results.
Just thinking out loud on the base nulling performance - if you had a bridge with all four arms the same (eg. each arm was the 4 resistor 1k combination), then would the result be just an attenuated spectrum of the source generator signal. And would the attenuation level (depth of null) be related to the matching of arms, and could that be tweaked (assuming just resistive tweaking is what's of influence). And would that then show the baseline harmonic levels inherent in the test setup.
If you didn't have absolute resistance measurement facilities with enough resolution, then I'd guess you could use the bridge null and single 1k resistor arms to sort out matching resistors. I recently restored a vintage PYE bridge with 0.01% spec resistors, but didn't have enough incentive to see if it could balance at anything but DC, given the plethora of manganin coils.
Last edited:
- Home
- Design & Build
- Parts
- What causes resistor distortion?