Fun With Log
Hello All,
Jan, Last things first.
I am still sorting the inner workings of the metal film vs ceramic core and heating cooling effects.
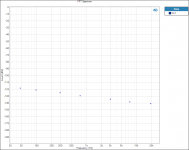
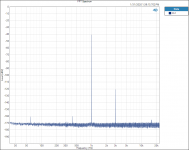
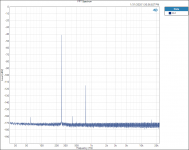
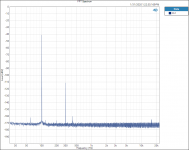
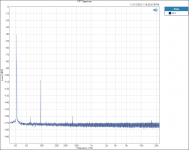
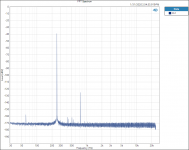
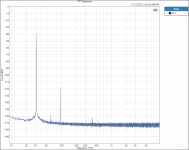
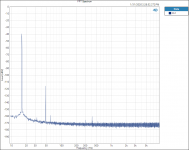
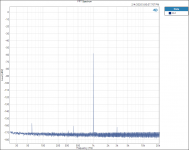
I did find one thing that is interesting to me. Testing and plotting FFT’s for the Vishay RN65E 25 ppm TCR resistor;
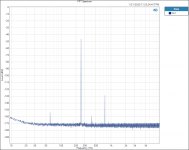
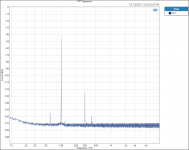
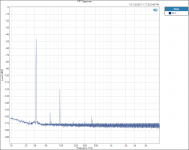
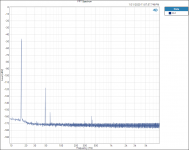
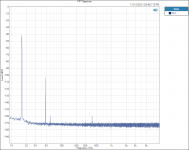
Tested at 16hZ with 3rd Harmonic of 48 hZ.
Tested at 31.5hZ with 3rd Harmonic of 94.5 hZ.
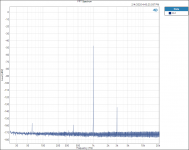
Tested at 100hZ with 3rd Harmonic of 300 hZ.
Tested at 250hZ with 3rd Harmonic of 750 hZ.
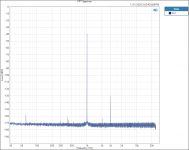
Tested at 1000 hZ with 3rd Harmonic of 3000 hZ.
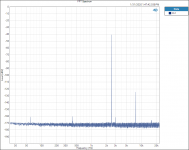
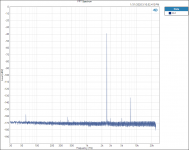
Tested at 2500 hZ with 3rd Harmonic of 7500 hZ.
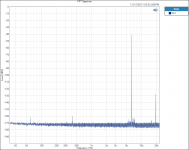
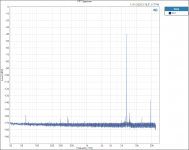
Tested at 6300 hZ with 3rd Harmonic of 18900 hZ.
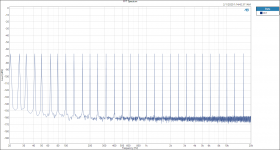
When plotted on a Log graph the magnitude of all the 3rd Harmonics all fall in a straight line with no lumps bumps or peaks; linear on the Log graph paper plot, no curve fitting required.
See attached plots.
It is too late tonight for the other plots and comments about the Vishay metal film RN55, RN60 and RN65 family of 25 and 100ppm TCR resistors.
Thanks DT
Hello All,
Jan, Last things first.
I am still sorting the inner workings of the metal film vs ceramic core and heating cooling effects.
I did find one thing that is interesting to me. Testing and plotting FFT’s for the Vishay RN65E 25 ppm TCR resistor;
Tested at 16hZ with 3rd Harmonic of 48 hZ.
Tested at 31.5hZ with 3rd Harmonic of 94.5 hZ.
Tested at 100hZ with 3rd Harmonic of 300 hZ.
Tested at 250hZ with 3rd Harmonic of 750 hZ.
Tested at 1000 hZ with 3rd Harmonic of 3000 hZ.
Tested at 2500 hZ with 3rd Harmonic of 7500 hZ.
Tested at 6300 hZ with 3rd Harmonic of 18900 hZ.
When plotted on a Log graph the magnitude of all the 3rd Harmonics all fall in a straight line with no lumps bumps or peaks; linear on the Log graph paper plot, no curve fitting required.
See attached plots.
It is too late tonight for the other plots and comments about the Vishay metal film RN55, RN60 and RN65 family of 25 and 100ppm TCR resistors.
Thanks DT
Attachments
-
 3rd Hs Fall In Line.png16.7 KB · Views: 349
 -
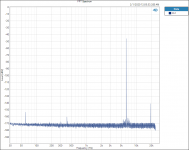 FFT 6300hZ RN65E.PNG43.9 KB · Views: 139
 -
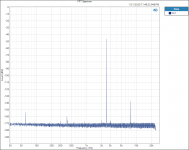 FFT 2500hZ RN65E.PNG43.7 KB · Views: 148
 -
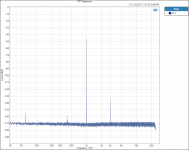 FFT 1000hZ RN65E.PNG44.6 KB · Views: 150
 -
 FFT 250hZ RN65E.PNG46.6 KB · Views: 334
 -
 FFT 100hZ RN65E.PNG46.9 KB · Views: 336
 -
 FFT 31.5hZ RN65E.PNG46.5 KB · Views: 320
 -
 FFT 16hZ RN65E.png46.9 KB · Views: 342
Last edited:
So are these plots from an instantaneous test or have the resistors had current running though then for an hour?
So are these plots from an instantaneous test or have the resistors had current running though then for an hour?
Fully warmed up. Each plot is the result of 20 averages.
Still running.
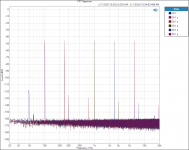
Check this 32 multitone plot.
Attachments
Fully warmed up. Each plot is the result of 20 averages.
Still running.
Check this 32 multitone plot.
#like 🙂
The constant level of the fundamental in that set of results would indicate that the static operating temperatures of all bridge arms don't change between tests.
Hello All,
For fun I put 6 sets of sliding, RN65E, FFT outputs on an appended plot. See attached.
For grins print the plot, take a straight edge and draw a line across the top of the 3rd Harmonics. That makes for a Log fitting model.
Thanks DT
For fun I put 6 sets of sliding, RN65E, FFT outputs on an appended plot. See attached.
For grins print the plot, take a straight edge and draw a line across the top of the 3rd Harmonics. That makes for a Log fitting model.
Thanks DT
Attachments
DualTriode's post 201 reminded me of the fact that you usually get sqrt(s tau) terms in transfer functions related to heat transfer, so I guess it has to be
1/(sqrt(s tau1) + 1) - 1/(sqrt(s tau2) + 1) = (sqrt(tau2) - sqrt(tau1)) sqrt(s)/((sqrt(s tau1) + 1) (sqrt(s tau2) + 1))
which is an even wider bandpass. For s = j omega, it first increases with 10 dB/decade, then has a very wide peak, and then drops with 10 dB/decade.
Apparently the resistors DualTriode measured have no compensation effect between two thermal effects with different time constants, or the larger time constant is so large that it plays no role at the lowest frequency of measurement.
When plotted on a Log graph the magnitude of all the 3rd Harmonics all fall in a straight line with no lumps bumps or peaks; linear on the Log graph paper plot, no curve fitting required.
I see it is a near perfect 10 dB/decade drop with increasing frequency. Without compensation effects between different thermal effects, you probably have something like this:
Sine wave current to momentary power: instantaneous so frequency-independent, power depends on the square of the current so the momentary power has components at 0 and 2 times the signal frequency.
Momentary power to momentary temperature: thermal diffusion process, so -10 dB/decade above the thermal cut-off frequency. More or less linear, so the temperature variations also get components at 0 and 2 times the signal frequency.
Momentary temperature to momentary resistance: instantaneous, so frequency-independent (that is, the resistance variations get the same -10 dB/decade drop with frequency as the temperature variations). More or less linear, so the resistance variations also get components at 0 and 2 times the signal frequency.
Resistance to voltage: the signal current gets multiplied with a resistance that has components at 0 and 2 times the signal frequency, so the voltage gets frequency components at 1 and 3 times the signal frequency. The resistance variation at 2 times the signal frequency drops with 10 dB/decade, so so does the distortion due to thermal effects.
Hello,
There is a similar sloping straight line through the metal foil resistor FFT plots in post 160 and post 161.
Thanks DT
Edit: I am thinking distortion magnitude (dB's) is a inverse function of frequency not frequency independent.
There is a similar sloping straight line through the metal foil resistor FFT plots in post 160 and post 161.
Thanks DT
Edit: I am thinking distortion magnitude (dB's) is a inverse function of frequency not frequency independent.
Last edited:
Very interesting sets of posts above. I believe this has not been done before; even the Vishay people we communicated with hadn't this to offer. They did offer samples to b measured, which were to be send to ES for measurements.
Jan
Jan
I see it is a near perfect 10 dB/decade drop with increasing frequency. Without compensation effects between different thermal effects, you probably have something like this:
Sine wave current to momentary power: instantaneous so frequency-independent, power depends on the square of the current so the momentary power has components at 0 and 2 times the signal frequency.
Momentary power to momentary temperature: thermal diffusion process, so -10 dB/decade above the thermal cut-off frequency. More or less linear, so the temperature variations also get components at 0 and 2 times the signal frequency.
Momentary temperature to momentary resistance: instantaneous, so frequency-independent (that is, the resistance variations get the same -10 dB/decade drop with frequency as the temperature variations). More or less linear, so the resistance variations also get components at 0 and 2 times the signal frequency.
Resistance to voltage: the signal current gets multiplied with a resistance that has components at 0 and 2 times the signal frequency, so the voltage gets frequency components at 1 and 3 times the signal frequency. The resistance variation at 2 times the signal frequency drops with 10 dB/decade, so so does the distortion due to thermal effects.
So Marcel this means that the distortion spectrum caused by the thermal modulation looks different depending on whether the resistor is current driven or voltage driven.
Jan
Hardly, because the only difference (apart from swapping the words current and voltage) is that the multiplication by the momentary resistance in the last step becomes a division by the momentary resistance. As the resistance variations are extremely small compared to the average resistance, you can use a first-order Taylor approximation to change the division back into a multiplication:
v/(Rav + delta R) = v/(Rav*(1 + delta R/Rav)) ~= (v/Rav) * (1 - delta R/Rav)
with delta R the resistance variation and Rav the average resistance. (You might argue that it is more consistent to use the resistance without signal instead of the average resistance with signal, but for the conclusion it doesn't matter.)
The higher terms of the Taylor series all depend on (delta R/Rav)^n with n > 1, so they will be much smaller than delta R/Rav. Maybe you get an extra -300 dB fifth-harmonic distortion term when the third-order distortion is -150 dB.
Hello All,
Here are the plots for the RN60D metal film resistor.
The 2nd H is showing up a little. The same 20volt input. The same sloping 3rd H magnitude with frequency increase.
Thanks DT
Here are the plots for the RN60D metal film resistor.
The 2nd H is showing up a little. The same 20volt input. The same sloping 3rd H magnitude with frequency increase.
Thanks DT
Attachments
Hello All,
Here are the plots for the RN60E metal film resistor.
The 2nd H is showing up a little. The same 20volt input. The same sloping 3rd H magnitude with frequency increase.
Thanks DT
Here are the plots for the RN60E metal film resistor.
The 2nd H is showing up a little. The same 20volt input. The same sloping 3rd H magnitude with frequency increase.
Thanks DT
Attachments

Hello Marcel and All,
I am not ready to shoehorn the modeling of distortion behavior of these thin (metal) film resistors into a Taylor Series. Bruce Hofer in his Audio Xpress articles uses a Taylor Series to model the distortion of discrete transistor circuits but not the voltage or power nonlinearity of resistors.
Thanks DT
https://www.ap.com/download/designi...itUSh4ggygNfkpyQRZ6a5kVtYDckWA5HjR1GqUT0sIktA
Hello Marcel and All,
I am not ready to shoehorn the modeling of distortion behavior of these thin (metal) film resistors into a Taylor Series. Bruce Hofer in his Audio Xpress articles uses a Taylor Series to model the distortion of discrete transistor circuits but not the voltage or power nonlinearity of resistors.
Thanks DT
Neither do I, I just use Taylor series to explain that there is not much difference in distortion between the voltage across current driven resistors and the current through voltage driven resistors.
As far as I'm concerned, because I haven't a clue what ODE means.
Ordinary Differential Equation 🙂
Hello All,
Last time I posted constant power input FFT plots with varying frequency. On the Log/Log scale plots 3rd H vs frequency a straight line was able to connect the peaks of the plotted 3rd harmonics.
Today with frequency being held constant and the input voltage/power varied there is a linear relationship between the resistor power dissipation and the height of the 3rd Harmonic. ( on the Log/Log plot)
Interesting at least to me.
Thanks DT
Attachments


- Home
- Design & Build
- Parts
- What causes resistor distortion?