Yes, I meant center of gravity to get even load on the central bearing.
I thought about giving an offset to the driver, but that would most probably not work.
First thing will be to make it turn with the speaker in the center. If that works, I will try different mechanical arrangements with rollers or a counter balance.
Or it might be actually easier to make the mic holder rotate, but that would be good for outdoor measurements only.
Member
Joined 2003
In the merge tool.
Here's an example of bad merge. It's not expected to see higher amplitude off-axis at low frequency for a monopole speaker:

Additionally, this error will show that power response is higher amplitude than on-axis response at low frequency, another red flag:

With "force to gradient" the issue is corrected:

Here's an example of bad merge. It's not expected to see higher amplitude off-axis at low frequency for a monopole speaker:
Additionally, this error will show that power response is higher amplitude than on-axis response at low frequency, another red flag:
With "force to gradient" the issue is corrected:
Last edited:

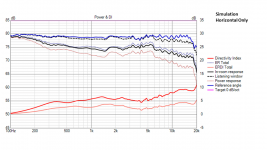
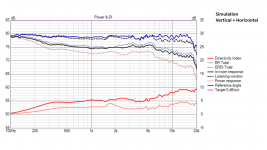
For the speaker you’ve shown, you may be able to get away without vertical measurements at all, since all the drivers are round and located middle of a symmetrical baffle. Assuming you’ve already gathered data for that speaker, have you compared the Power & DI chart with full data set vs just loading horizontal measurements?
I have all the necessary measurements. I will take a look at this tomorrow.
My build thread was long and meandering, but you may find it interesting...
https://www.diyaudio.com/community/threads/new-project-tower-3-way-with-twin-8s.378223/
This depends on combination of speaker concept, room acoustics and listening setup. More constant directivity (flat DI) or harsh room acoustics -> higher tilt for PIR and SP are probably needed.How much of a slope from 100-10 000 Hz should one aim for when setting a target power response/in-room response?
Seems most go for about -5 db
I have calculated some statistics on 15 pcs Genelec, Hedd, Kef, Neumann and Taipuu speakers. Average slope of predicted in-room response (PIR) is ca. -0.9 dB/oct. Some of those were equalized flat, but not all. Average PIR slope of my designs is closer to -0.96 dB/oct. Calculation of Preference rating by Olive prefers some combination of PIR and ON slopes, but that is suspected to be just a mistake (slope-dependence) in calculation of SM and NBD.
Average slope of sound power directivity index (SPDI) is ca. -1.3 dB/oct so average slope of power response (SP) would be ca. -1.4 dB/oct. assuming that slope of listening window (LW) is -0.1 dB/oct.
Last edited:
Hi everyone!
This is my first post, but im using VituixCAD since a while now to design my own loadspeakers.
So far, it has been very successful and I have to say im very impressed by the tool and what it can do. Thank you so much!
Until now, I've had a very good match between simulation and actual measurements with many speakers (once the crossover was built). But recently I had a weird issue which I need some help understanding.
In my recent 2 way speaker build, the tweeter level of the simulation is far off the real measured tweeter level (about 3dB offset) and I'm wondering why this might be.
First, here is what I did:
I am using a calibrated Sonarworks XREF 20 and a loopback timing reference for correct timing offsets.
When measuring the finished Xover for my latest speaker, the impedance curve matched the simulation perfectly, however, the FR was off. The tweeter was running about 3 db too hot! This was also very audible in my listening tests, the speaker was bright! The microphone was positioned the same way as for the raw driver measurements (between tweeter and woofer at around 70cm).
I adjusted the resistors of the xovers until the FR matched the simulation. I realized that I needed about 3-4 ohms more of resistance in front of the tweeter to match the FR, which is quite a lot! I also double checked the resistance of the tweeter circuit with a simple multimeter. I measured 10.3 ohms which matches the 6.8+3.3 ohm resistors almost perfectly.
So now I am wondering how to explain this offset. Does anyone have an idea what went wrong? Did I miss something?
Here are some screenshots, showing the issue. Please ignore the redundant parts of the crossover (had to improvise a bit because I lacked some parts 😀). Note that these only contain on axis data without nearfield measurements:
As you can see in the last screenshot, when shorting the 3.3 ohm resistor the FR matches almost perfectly, however, the impedance of the speaker changes a lot in the tweeter region as well. Strangely, I do not see this in the impedance measurement (Matches the original simulation perfectly).
Simulation of on axis FR:

Measured on axis FR with same xover:

Same simulation, but without the 3.3 ohm resistor:

Kind Regards,
Philipp
This is my first post, but im using VituixCAD since a while now to design my own loadspeakers.
So far, it has been very successful and I have to say im very impressed by the tool and what it can do. Thank you so much!
Until now, I've had a very good match between simulation and actual measurements with many speakers (once the crossover was built). But recently I had a weird issue which I need some help understanding.
In my recent 2 way speaker build, the tweeter level of the simulation is far off the real measured tweeter level (about 3dB offset) and I'm wondering why this might be.
First, here is what I did:
- Build enclosure and mount the drivers
- Measure impedance of each driver
- Compare impedance measurement with manifacturer data - should be plausible
- Measure (on and off axis) gated frequency response of the drivers in the far field (microphone at fixed position)
- Import frequency responses and impedance into VituixCAD
- Remove scaling and mounting position offsets in Vituix (as Timing offset is already included in the measurements)
- Design Xover in Vituix
- Build Xover
- Measure Impedance and compare to VituixCAD simulation
- Measure FR of Xover (as close as possible to original measurement positions)
I am using a calibrated Sonarworks XREF 20 and a loopback timing reference for correct timing offsets.
When measuring the finished Xover for my latest speaker, the impedance curve matched the simulation perfectly, however, the FR was off. The tweeter was running about 3 db too hot! This was also very audible in my listening tests, the speaker was bright! The microphone was positioned the same way as for the raw driver measurements (between tweeter and woofer at around 70cm).
I adjusted the resistors of the xovers until the FR matched the simulation. I realized that I needed about 3-4 ohms more of resistance in front of the tweeter to match the FR, which is quite a lot! I also double checked the resistance of the tweeter circuit with a simple multimeter. I measured 10.3 ohms which matches the 6.8+3.3 ohm resistors almost perfectly.
So now I am wondering how to explain this offset. Does anyone have an idea what went wrong? Did I miss something?
Here are some screenshots, showing the issue. Please ignore the redundant parts of the crossover (had to improvise a bit because I lacked some parts 😀). Note that these only contain on axis data without nearfield measurements:
As you can see in the last screenshot, when shorting the 3.3 ohm resistor the FR matches almost perfectly, however, the impedance of the speaker changes a lot in the tweeter region as well. Strangely, I do not see this in the impedance measurement (Matches the original simulation perfectly).
Simulation of on axis FR:
Measured on axis FR with same xover:
Same simulation, but without the 3.3 ohm resistor:
Kind Regards,
Philipp
Last edited:
For some reason I cant edit my original post, but here are the measured raw impedences of the drivers and the simulated total impedance of the XO.
Unfortunately I didnt save the impedance of the real XO, but it matched perfectly (+- 0.2 ohm maybe), while the tweeter is 3db too loud.
The values for tweeter and woofer seem reasonable to me.
Tweeter: Dayton Audio ND25FW-4 1"
Woofer: Dayton Audio RS150P-8A 6"

Unfortunately I didnt save the impedance of the real XO, but it matched perfectly (+- 0.2 ohm maybe), while the tweeter is 3db too loud.
The values for tweeter and woofer seem reasonable to me.
Tweeter: Dayton Audio ND25FW-4 1"
Woofer: Dayton Audio RS150P-8A 6"
Member
Joined 2003
Apart from many red flags in the measurement process (suggest reading through VituixCAD measurement guide), for your specific problem at hand, first check would be to simple re-measure woofer and tweeter on-axis and compare the amplitude against your design data, to ensure that you haven't bumped the amp volume or measurement level between measurements. Another check would be to confirm scaling values in driver tab for each driver are not adjusted, not shown in your screenshots.
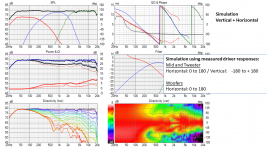
In the past, I have measured the horizontal and vertical polar responses of smaller two-way mid-tweeter systems, and I have achieved a near perfect match between simulation and measured system response. This included power response, DI, ER, etc. In order to get this level of agreement between simulation and system measurements, I found I need to measure both vertical and horizontal polars, both at the driver level and at the system level. For these systems, I cross to a large sealed woofer box in the 160 – 200 Hz range, so there has never been a need to capture polar response or directivity of the woofer.@hifijim For the speaker you’ve shown, you may be able to get away without vertical measurements at all, since all the drivers are round and located middle of a symmetrical baffle. Assuming you’ve already gathered data for that speaker, have you compared the Power & DI chart with full data set vs just loading horizontal measurements?
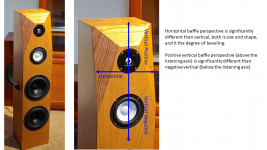
When I started this project, I assumed I needed to proceed in the same way. The shape of the baffle and bevels around the tweeter and midrange led me to believe that the vertical polar response might be significantly different than the horizontal. From the horizontal perspective, the baffle is very narrow. From the vertical perspective, it is a very tall baffle. It is also highly non-symmetric in the vertical direction, meaning that positive vertical angles have a significantly different baffle perspective than negative vertical angles.
However, I did not anticipate how difficult it would be to make vertical polar measurements of an 88 lb speaker. The rotating table shown in post #4239 was the second attempt after the first rotating jig failed to work. It was a lot of added complexity to the measurement phase of the project. So @DcibeL has a very valid question as to whether or not this extra work actually adds value.
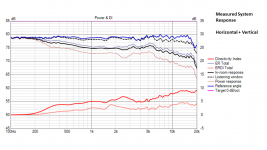
After looking at all the results of the completed system, I conclude that having the vertical polar measurements made a small difference. If I had simply used the horizontal polar responses, I would have ended up with the same DSP filters, or so close to the same as to be negligible. Final tuning is done by listening in any case, so I think I would have ended up with exactly the same final product.
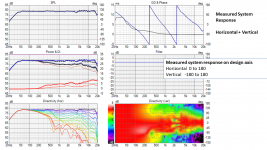
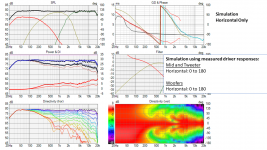
Neither of the two simulated responses are an exact match to the measured response, unlike my previous projects which were all smaller 2-ways. I have a theory about that. When the speaker was positioned horizontally on the table for vertical polar measurements, it rotates through a circle that is almost 8 feet in diameter. When the speaker was rotated to -90 degree position, the bottom of the speaker was only about 6 inches from the microphone at that point, so this was not really a valid far-field measurement. In addition, I am certain there was some diffraction caused by the table. Both of these factors are unavoidable given the size and weight of the speaker, but I think they explain why the simulations differ from the measured system response.
j.
edit: I am not sure why my attachments did not post in the correct order... should be slide1, slide2, slide3... etc.
Attachments
Last edited:
Apart from many red flags in the measurement process (suggest reading through VituixCAD measurement guide), for your specific problem at hand, first check would be to simple re-measure woofer and tweeter on-axis and compare the amplitude against your design data, to ensure that you haven't bumped the amp volume or measurement level between measurements. Another check would be to confirm scaling values in driver tab for each driver are not adjusted, not shown in your screenshots.
Hi,
I would be very interessted in improving my measurement process! 🙂 Would you mind explaining which red flags you mean specifically?! I've read through the REW + Vituix Tutorial and thought to match it quite well.
Note that I intentionally left out many steps (e.g. NF measurements and baffle step correction) because I figured they are irrelevant for the tweeter level issue.
Regarding your suggestions: I already did that today. In fact, the data from the screenshots was from todays measurements. I took the driver and total XO measurement in the same conditions, same day, literally just re-soldered them on the XO. 😀
Here is what I checked already:
- Double checked loaded mic & soundcard calibration in REW
- Check against Umik1 FR - Same result
- Use a different Amp for the final FR measurement (Class D) - same result
- Raw measured Impedance response of the tweeter vs manifacturer spec --> matched very closely. Im also using a calibrated impedance measurement (using REW calibration) to remove slight additional resistance from bad soldering and cables. I think that even if there is a small error here it cant explain the large offset, as impedance would have to be far off (approx factor 2) to explain 3 db offset.
- Impedance scaling in VituixCAD set to 1.0
- Frequency response scaling/offsets in vituix for all drivers set to 0.
- 0 offsets for all drivers in vituix
- Measure actual resistor values with multimeter --> seems ok.
I'm wondering if there is a way I could have messed up the real XO which alters the tweeter FR without actually being visible in the Impedance Measurement.
Perhaps too obvious, but do both speakers measure the same?
(from personal experience: I had a Dayton tweeter measuring way off...)
Oh, maybe this is a misunderstanding, but this is the same speaker and tweeter. I just compared simulation with actual measurement.
I am aware of large manifacturing tolerances (especially with tweeters), but those cant be at fault here 😀
Regards,
Philipp
Member
Joined 2003
This suggestion was based on past information provided by Kimmo, where the difference in overall power & DI chart is not greatly affected by the difference in diffraction response of the vertical plane, so there may not be much value in measuring vertical plane if the drivers are round and normal rectangular baffle, esp symmetrical layout.However, I did not anticipate how difficult it would be to make vertical polar measurements of an 88 lb speaker. The rotating table shown in post #4239 was the second attempt after the first rotating jig failed to work. It was a lot of added complexity to the measurement phase of the project. So @DcibeL has a very valid question as to whether or not this extra work actually adds value.
Main thing to keep in mind for comparing measurement of final speaker to simulation in VituixCAD, is if your measurement of final speaker is at 1m, change listening distance in VituixCAD to 1m for comparison. For big speakers this difference between measurement distance and actual listening distance can be quite significant. Just remember to change back to normal listening distance 2-3m when complete.Neither of the two simulated responses are an exact match to the measured response, unlike my previous projects which were all smaller 2-ways. I have a theory about that. When the speaker was positioned horizontally on the table for vertical polar measurements, it rotates through a circle that is almost 8 feet in diameter. When the speaker was rotated to -90 degree position, the bottom of the speaker was only about 6 inches from the microphone at that point, so this was not really a valid far-field measurement. In addition, I am certain there was some diffraction caused by the table. Both of these factors are unavoidable given the size and weight of the speaker, but I think they explain why the simulations differ from the measured system response.
Member
Joined 2003
First is that you've left the mic stationary for all measurements. Each driver measured individually should be measured on the driver's axis (mic in line with driver), and distance from mic to baffle surface remains constant. Driver offsets in crossover then are physical driver offsets, so relative x,y should be incorporated here. This allows for 0deg driver data to actually be 0deg, not some off-axis angle due to stationary mic location, providing correct Power & DI response and directivity relative to actual driver position (though you've turned these responses off in your screenshot) and listening distance, as well as actual simulation response at listening distance. Leaving mic at stationary location for all measurements essentially locks the simulation to the mic distance. For large speakers, difference in response from 1m to actual 2-3m listening distance can be significant.I would be very interessted in improving my measurement process! 🙂 Would you mind explaining which red flags you mean specifically?! I've read through the REW + Vituix Tutorial and thought to match it quite well.
Note that I intentionally left out many steps (e.g. NF measurements and baffle step correction) because I figured they are irrelevant for the tweeter level issue.
You also have a lot of excess phase, total time of flight from speaker to mic included in the phase data, which isn't a problem in itself other than it makes the phase plot very busy. Basically, go back through measurement instructions and follow exactly, some steps are clearly being missed. A "bandaid" for the excess phase could be to apply a negative delay value in the driver tab, equal to distance mic to baffle surface, for example 1m would be -2907us.
Member
Joined 2003
@hifijim Just some supplemental information, wording about the vertical axis is included in VituixCAD measurement guide:This suggestion was based on past information provided by Kimmo, where the difference in overall power & DI chart is not greatly affected by the difference in diffraction response of the vertical plane, so there may not be much value in measuring vertical plane if the drivers are round and normal rectangular baffle, esp symmetrical layout.
Main thing to keep in mind for comparing measurement of final speaker to simulation in VituixCAD, is if your measurement of final speaker is at 1m, change listening distance in VituixCAD to 1m for comparison. For big speakers this difference between measurement distance and actual listening distance can be quite significant. Just remember to change back to normal listening distance 2-3m when complete.
Measurement of vertical plane can be skipped if the driver and possible wave guide/horn are circular i.e. directivity in vertical plane is equal to horizontal plane. Skipping of vertical plane could cause small hump (<1 dB) to power response at diffraction peak frequency if baffle height is much longer than width. In that case sound balancing should be weighted by on-axial response around diffraction peak frequency (wave length = baffle width).
VCAD manual for measurement in REW, instructions for Far field measurements;
Range: 5…41000 Hz (full range to avoid extrapolation of response files in VituixCAD)
Does this apply to tweeter as well? Worried about damaging the tweeter with a 5hz signal, so I have measured tweeter with a 500-41000 sweep.
Will this affect any aspect of simulation in VCAD, and if so why?
Range: 5…41000 Hz (full range to avoid extrapolation of response files in VituixCAD)
Does this apply to tweeter as well? Worried about damaging the tweeter with a 5hz signal, so I have measured tweeter with a 500-41000 sweep.
Will this affect any aspect of simulation in VCAD, and if so why?
Hi, as long as I've understood stuff right sweep is constant power so most excursion happens at the tweeter resonance so around 1kHz or something, not so much on low or high frequencies as long as power is low, 1W / 2.83v or what have you. Tweeters pop-out if you apply pink noise or something, that has great power fed on low frequencies, like DC pop on the amp output while plugging stuff in, dropping a microphone / turntable needle or something. Basically an accident / human error. If you have expensive tweeter you might want to protect it from accidents. Either use big capacitor well out of band, like >50uF or something so that its effect on intended pass band is minimal, or use capacitor you are likely going to use in the circuit anyway and leave it in. Basically, adjusting measurement sweep frequency shouldn't matter, accidents happen no matter what your sweep settings are.
Thanks tmuikku.Basically, adjusting measurement sweep frequency shouldn't matter, accidents happen no matter what your sweep settings are.
It is this statement "to avoid extrapolation of response files in VituixCAD", that made me rethink if I can actually use my tweeter measurements based on 500-41000hz sweeps. Can you or anyone else verify this?
I haven't compared results how big error there would be from extrapolation, but here is some reasoning:
Error from extrapolation compared to reality below 500Hz depends on which tweeter you have. If the tweeter starts to roll off few octaves above, around 2kHz, the tweeter would probably measure steady slope at 500Hz and the extrapolation would match reality quite fine. If the tweeter had capability to play down to 500Hz and had some lumpy response there the extrapolation would probably differ from real measurements, and you'd get some error. Given that semi-anechoic home measurements usually have rather short windowing resolution of measurements below 500Hz would be poor anyway, so some error no matter what. I'd say measurements of a typical tweeter from 500Hz and up is fine if your crossover is few octaves above. Error from extrapolation wouldn't be much of a concern.
Unless someone else comes in and says it is 😀
If you are doing passive crossover not sure if there is much you can do, I suspect error is so small you'd probably arrive similar /same components be there extrapolation or not. On a DSP system its possible to "overcompensate" for small things in responses and probability to transfer small errors in data to errors in sound is much higher.
Last edited:
- Home
- Design & Build
- Software Tools
- VituixCAD