Member
Joined 2003
Diffraction tool is limited for this type of "simulation". VituixCAD is not an advanced FEM modeller, best process is to mount your driver on a baffle and measure off-axis response. For simulation, possibly Akabak could help you, but be prepared for a steep learning curve.
The manufacturer has supplied polar measurements I want to use those and simulate baffle and crossover effects. But yes Dcibel your real world approach is better. Just trying to decide If the tectonic BMR will have better polars after crossover and baffle compared to a regular dome.
How can I simulate a Tectonic BMR in Vituixcad? As I understand the diffraction tool I think it's using sd in it's beamwidth calculations. A BMR effectively has a variable sd. The manufacturer has polar diagrams here https://www.parts-express.com/pedocs/specs/297-2176--tectonic-tebm54c30-8-spec-sheet.pdf
I'd like to see how a baffle effects the polars as well as add a helper woofer.
I'd like to see how a baffle effects the polars as well as add a helper woofer.
Member
Joined 2003
Primary diffraction effects will occur up to 4kHz max, for this frequency range I would use driver Sd in diffraction tool. Operation of driver at high frequency may be effectively smaller Sd, so you may want to ignore off-axis interference that occurs when simulating diffraction directivity using datasheet Sd. I think that will be the best you'll get as far as a "simulation", diffraction tool in this situation is aiding baffle location only for that insight, in which case the effective Sd is somewhat irrelevant. For real insight of the driver's directivity, mount the driver on a baffle and measure it.

I'm having a problem with converting my Impulse Response file (from Hypex HFD) to an FRD flle. After I select the file I get an errormessage: 'The samplerate is not 44.1, 48, 88.2 etc'.
I'm pretty sure the samplerate is 48 KHz. Furthermore, it's not the first time I've done this. I never had a problem before.
Does anyone know what's going on? I've attached the Hypex file.
I'm pretty sure the samplerate is 48 KHz. Furthermore, it's not the first time I've done this. I never had a problem before.
Does anyone know what's going on? I've attached the Hypex file.
Attachments
Sd affects directivity so it does have an effect on diffraction at higher frequencies. The diffraction tool does not consider breakup or BMR, which is reasonable for this type of tool.diffraction tool in this situation is aiding baffle location only for that insight, in which case the effective Sd is somewhat irrelevant.
Member
Joined 2003
I don't know what you're trying to argue, but directivity and breakup should be measured. VituixCAD diffraction tool is not the tool for this type of computer model, more advanced math is required.
Not sure if this has been asked previously, but I cannot find in the manual a way to mantain 5 dB intervals with spans of more than 50 dB. From 60 dB span the program always changes to 10 dB intervals. I am referring to SPL main graph. Any idea?
Thanks in advance.
Thanks in advance.
Automatic interval is the easiest and fastest and must support the smallest display size. 5 dB can be okay for zoomed views and 4K but that is not whole story.

When I rotate my baffle simulated driver past 90degrees the polars dissappear... what did I do wrong?
Member
Joined 2003
How much of a slope from 100-10 000 Hz should one aim for when setting a target power response/in-room response?
Seems most go for about -5 db
Seems most go for about -5 db
What apparently is important is a smooth curve. Which is a result of a smooth frequency response both on and off axis in combination with room placement of speakers and other objects in the room, as well as reflection & absorption of wall floor and ceiling.
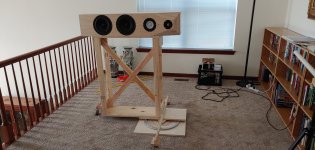
I am building an automated turn table for polar measurements. Is there any way to compensate for the fact that the axis of rotation is center of gravity instead of center of the front baffle?
Member
Joined 2003
I personally focus more on in-room (orange) than power response for an optimization target. In either case, increase the lower end of your target to 300Hz range instead of 100, where the speaker starts to become directional, there’s nothing to optimize at 100Hz.How much of a slope from 100-10 000 Hz should one aim for when setting a target power response/in-room response?
Seems most go for about -5 db
For in-room, a good starting point would be -0.7dB/oct, but that may vary based on drivers used and crossover points, so sim for a target “trend line” from 300-400Hz up to 8-10kHz.
I also prefer to use listening window instead of on-axis response for axial target, at about -0.15dB/oct.
Once you get a decent result there, you might try further optimization with the preference rating features, but you may find little changes/improvements are made.
Member
Joined 2003
I hope you just mean centre of the cabinet, which won’t be the centre of gravity, it’ll be front heavy 😉I am building an automated turn table for polar measurements. Is there any way to compensate for the fact that the axis of rotation is center of gravity instead of center of the front baffle?
I would focus efforts on building the turntable in a way that allows you to use the front of the baffle as the pivot point, rather than trying to fix measurement data that doesn’t use this pivot point.
I always position the speaker so that the axis of rotation aligns with the front baffle, specifically the center of the tweeter. This means the center of gravity is NOT over the center of rotation, and it can be challenging to get good measurements without the speaker falling off of the turntable. VituixCad may be able to take off-axis rotation into account, but I have never tried it.
When measuring the vertical response of a large speaker, it is sometimes necessary to suspend or support the speaker as it rotates.
When measuring the vertical response of a large speaker, it is sometimes necessary to suspend or support the speaker as it rotates.
Attachments
Member
Joined 2003
@hifijim For the speaker you’ve shown, you may be able to get away without vertical measurements at all, since all the drivers are round and located middle of a symmetrical baffle. Assuming you’ve already gathered data for that speaker, have you compared the Power & DI chart with full data set vs just loading horizontal measurements?
For measurement centre of rotation, of course you can compensate each measurement with delay for the location measured vs where it should have been, but it gets tedious/complicated with increased chance of error, as well the windowing of each measurement can get to be a fair bit off due to physical distance of speaker to mic at various angles. I would just avoid this scenario if at all possible, it’s “asking for trouble”.
For measurement centre of rotation, of course you can compensate each measurement with delay for the location measured vs where it should have been, but it gets tedious/complicated with increased chance of error, as well the windowing of each measurement can get to be a fair bit off due to physical distance of speaker to mic at various angles. I would just avoid this scenario if at all possible, it’s “asking for trouble”.
- Home
- Design & Build
- Software Tools
- VituixCAD