


Days later i can present you the Aleph3 clone residual and distortion values with real measurements…..
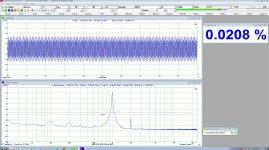
first picture starting left shows the distortion and phase measured in real for 1W and 8 Ohm load with Visual Analyzer.
The program is for free and you can see the phase of k2 and k3 etc. too, a treat that is not often implemented. K2 for the Aleph3 seems to be of positive phase.
second picture shows the Aleph3 clone under same conditions measured with Virtins Multi-Instruments program.
third picture shows the residual measured with this program. Doesn't this look really fine…..the trial is free for over 20 days.
I am so happy that David from Virtins showed me patiently three days long the steps to get the residual …… 🙂)
I will post the steps in a .pdf here soon.
So the phase seems to be positive here too.
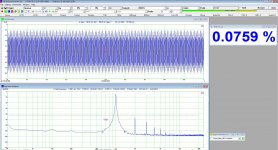
fourth picture shows distortion and phase measured again with Virtins at 10V output (8Ohm).
fifth picture shows the residual for the 10V output, you can see more k3.
Hope this all shows more the truth than Spice....... 😀😀😀
first picture starting left shows the distortion and phase measured in real for 1W and 8 Ohm load with Visual Analyzer.
The program is for free and you can see the phase of k2 and k3 etc. too, a treat that is not often implemented. K2 for the Aleph3 seems to be of positive phase.
second picture shows the Aleph3 clone under same conditions measured with Virtins Multi-Instruments program.
third picture shows the residual measured with this program. Doesn't this look really fine…..the trial is free for over 20 days.
I am so happy that David from Virtins showed me patiently three days long the steps to get the residual …… 🙂)
I will post the steps in a .pdf here soon.
So the phase seems to be positive here too.
fourth picture shows distortion and phase measured again with Virtins at 10V output (8Ohm).
fifth picture shows the residual for the 10V output, you can see more k3.
Hope this all shows more the truth than Spice....... 😀😀😀
Attachments

i published the PDF how to extract the residual out of the distortion data after areal measurement with Virtins Multi-Instruments here
http://www.diyaudio.com/forums/equi...e-view-distortion-residual-5.html#post4807837
where Jan Didden started with the residual problem some years ago….
😀😀😀
http://www.diyaudio.com/forums/equi...e-view-distortion-residual-5.html#post4807837
where Jan Didden started with the residual problem some years ago….
😀😀😀
Odd though that you are still seeing a positive phase 2nd harmonic at low
amplitudes when my units show negative phase.
😎
amplitudes when my units show negative phase.
😎
yes I was afraid of this….difference!
So I have no idea at the moment what I can do or where I make a fault.
I will build up an FW amp where I know that the phase is negative for sure and recheck the programs.
So I have no idea at the moment what I can do or where I make a fault.
I will build up an FW amp where I know that the phase is negative for sure and recheck the programs.
Teach me as well. How are you recognizing the phase of the 2nd harmonic. Are you looking at the residual waveform? I have a difficult time interpreting the residual waveform and seeing what is 'in' the distortion. Most of the time, I'm using a FFT to look at distortion. But I have hooked the FFT software to the output of the distortion analyzer to get a better understanding in what is remaining in the residual.
I found an article on the web that quoted an older book showing the difference between a majority of even harmonics Vs majority of odd harmonics Vs complex harmonics. I use this to help me along the way.
Thank you.
I found an article on the web that quoted an older book showing the difference between a majority of even harmonics Vs majority of odd harmonics Vs complex harmonics. I use this to help me along the way.
Thank you.
Skidave did you see my link to the PDF some postings above? There is a complete description.
Could you give us the link of the old book?
I tried to train with all the residuals Nelson published in the First Watt user manuals.
I will show here the residual pictures and my interpretation these days.
Is there anybody out who can test the Virtins software with my PDF with an amp that shows known k2 phase?
Here might by the explanation for the difference that Mr. Pass mentioned....
David from Virtins wrote me just again and will try it these days and implement David's correction for phase looking in the PDF!
"Hi Gerd,
Sorry, I forgot to mention one thing, if you want to compare the filtered data with the original one and make them time aligned, then please note that a FFT filter will not cause any phase shift (i.e. the filtered data are time aligned automatically with the original one), *while the FIR filter will cause a time delay of [FIR order]/2 * [Sampling Interval].* That is, if you use the 1022nd FIR filter window, the data will be delayed for 511 points. *To make the FIR filtered data time aligned with the original waveform, after FIR filtering, you need to go to [File]>[Extract], and save a wave file from the 512nd point to the last point.* Then when you combine the original one with the FIR filtered one, they will be time aligned. **If you are more interested in the phase comparison than the amplitude comparison, probably FFT filter is more convenient.
Best Regards
David"
I am happy he wrote this, it saves me much experiments I planned.
Last edited:
The Phase of the second harmonic could be the clue for a good tunning in many scenarios ?
Where can I read more about?
Where can I read more about?
At least the First Watt amps show different phases as far as I can judge.
It seems that Nelson trims the phase according to circuit and sound wise.
So I am afraid there is no general rule.
🙂)
It seems that Nelson trims the phase according to circuit and sound wise.
So I am afraid there is no general rule.
🙂)
Here you go...Basic Audio by Norman Crowhurst: Harmonic Distortion
I understand how you derived the information from the software. I'm trying to see how the phase is interpreted. Is the phase based on how the residual peaks relate to the fundamental?
Given the additional email you received from David at MI, can you repeat your tests and show the results again. Maybe one image as before and then one starting with point 512 so they are 'time aligned'. Visual info would help show the differences in the measurement and software calculation.
Thanks
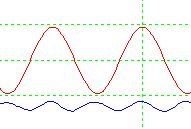
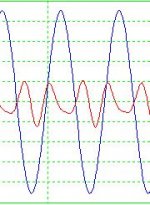
The posted Crowhurst link is a good one. In the first example seen, the
second harmonic is "positive in phase", that is to say the positive peak of the
2nd harmonic is aligned with both positive and negative peak of the
fundamental.
It is easy enough to generate the opposite case in many amplifiers if you
wish.
I have not seen discussions in the literature (apart from my own) about the
relative sound of the two phases, probably because it has been regarded
as not consequential.
However in blind and sighted listening tests people have noted the difference,
which is usually summarized as:
positive 2nd flattens the image out a bit and puts in a little more in your face
negative 2nd deepens the apparent image.
When I developed the SIT-1 amplifier, I put a user adjustable load line which
allowed either phase or a null on the second harmonic. After I got enough
feedback on the sound from listeners I ended up adjusting it so that the
center point of the meter reflected the negative 2nd setting adjustment
which seemed to be the most popular.
😎
I have the Crowhurst distortion images printed and laminated on a small card on my work bench. I refer to them often when looking at the residuals.
I just quickly re-read your article Nelson on passdiy.com as a refresher. Thank you.
Dave
I just quickly re-read your article Nelson on passdiy.com as a refresher. Thank you.
Dave
It would interesting to characterize the sound of the "sharpened" 3rd
harmonic as contrasted with the "flattened". The reason why I would
think this is that of the flattened represents compression, the sharpened
might across as decompression.
😎
harmonic as contrasted with the "flattened". The reason why I would
think this is that of the flattened represents compression, the sharpened
might across as decompression.
😎

TAM, TAM….😀😀😀
thanks to David from Virtins to whom no question was too silly…….
and Pa Nelson, who encouraged me by his bit to bit infos not to give up or stay with a wrong result….
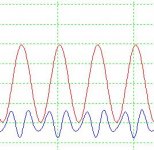
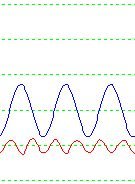
Residuals of my Aleph 3 clone, left at around 4V output at 8 Ohm und right the picture of the residual at 12V.
I also did the residual at 1W, but the residual was too small to give a clear picture in comparison to the fundamental.
I will continue to work out the pdF how to do it with Virtins software and a sound card.
thanks to David from Virtins to whom no question was too silly…….
and Pa Nelson, who encouraged me by his bit to bit infos not to give up or stay with a wrong result….
Residuals of my Aleph 3 clone, left at around 4V output at 8 Ohm und right the picture of the residual at 12V.
I also did the residual at 1W, but the residual was too small to give a clear picture in comparison to the fundamental.
I will continue to work out the pdF how to do it with Virtins software and a sound card.
Attachments
- Home
- Amplifiers
- Pass Labs
- The Aleph Design Reloaded