Most issues being corrected are minimum phase in nature and therefore the phase is corrected at the same time as the amplitude by an IIR filter.
If you know the crossovers that are used in your speakers or can take quasi anechoic measurements then you can use filters linearization to undo the phase turn of non linear phase crossovers.
When you go beyond that you need to know how and what you are measuring to decide what should be corrected or left alone. If you don't have that knowledge leave it alone or experiment to see what the effects are.
This is all so true, ime.
Imo, the only 'phase only' corrections that are automatically valid, is when undoing IIR xover phase.
Otherwise, phase corrections should be via minimum phase EQ and at the driver-by-driver level.
In band EQ is obvious. But it's also true of out-of-band EQ.
Just make sure the xover in place returns the corrected driver to safe and proper operating levels.
Oh, and by xover, i mean linear phase xover....why use anything else.😉
Global corrections of phase for a speaker with xovers already in place are perilous at best.
Global corrections of phase for a speaker with xovers already in place, and in a room, are plain nuts. imnsho 🙂
Thanks for the startup.
I watched those and its a headsup for me to understand the basics of FIR and how it works.
Thanks for sharing .
I watched those and its a headsup for me to understand the basics of FIR and how it works.
Thanks for sharing .
Thanks for all your comments .
I'm redoing all my calibrations this week, as i changed my front speaker with extreme toe method.. I will come up with some plots in each phase like dual Sub optimisation , then Sub+Main optimisation etc..Its easy for all if we have representative plots.
I will learn a lot in the coming future with all of your experiences.
I don't have that much Acoustical knowledge, but i'm very interested to learn and experiment.
I appreciate all the quick reply/responses you made yesterday.
BR
JIJI N K
@ Fluid,
just finished "REW average measurements and impulse correction rePhase" tutorial to pdf file. Anybody with energy welcome to take a look and make same corrections or notes in that pdf file.
File is "open" for corrections-no security protocol. With corrections finished will send to rephase.org for publishing.
Thanks to any one participating.
Attachments
Microphone is the English spelling 🙂
I think your raw example response looks quite good and would likely sound better than the "corrected" graph.
Flattening an in room measurement rarely gives a natural sound. I think this is an important point because people will often blindly follow a tutorial without thinking and create a filter that sounds worse.
DoneMicrophone is the English spelling 🙂
Was a bit lucky with drivers choice for my speakers, I think 🙄 have tray " corrected " graph and don't like it.I think your raw example response looks quite good and would likely sound better than the "corrected" graph.
That is absolute true -myself is a living example 😡 for a wile was on "flat" hysteria wave and have to fiddle with filter each second day,because listening music was a challenge-felt irritation in my ears and brain. And when got over "flat" virus things with sound have improved enormously .Flattening an in room measurement rarely gives a natural sound. I think this is an important point because people will often blindly follow a tutorial without thinking and create a filter that sounds worse.
Shall I add anything to tutorial text ?
May be to add about "flattening" as a suggestion ?
I'm not surprised 😉have tray " corrected " graph and don't like it.
I don't wish to be negative so please take this constructively. If I was writing the tutorial I would try and cover every step you took as it was that aspect of the swissbear tutorial that lead to your questions about it.Shall I add anything to tutorial text ?
May be to add about "flattening" as a suggestion ?
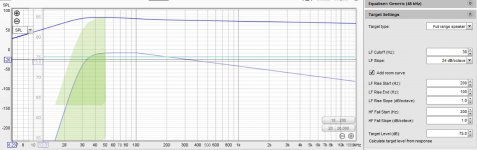
I would start with a target curve something like the screenshot. The LF rolloff point will depend on the ability of the speaker and what type it is. The ideal slope can vary by room and speaker as well as personal taste, anywhere from -0.8dB per octave to -1.2dB will usually work. If you haven't tried it you should the difference in 0.1dB per octave over that range can have a very large effect on the perceived tonality. An extra shelving cut can also help sometimes, putting one in the MiniDSP and sweeping it in real time could be worthwhile trying.
I ease the slope off at 100Hz some people like it to go down further. I find it makes things sound too bass heavy if I don't flatten at 100Hz.
My current approach is to flatten the response based on a windowed measurement that should be representative of the direct sound and then add PEQ shelving filters to reintroduce the slope but being adjustable I can tweak the slope at different points based on listening. This approach is not necessarily the best way for all speakers and rooms but it has proven to give the best sound for me so far.
Attachments
😀 Please do . Personally I like a lot, sarcasm it is my way to discuss and I think, easiest way to reach satisfactory resolution in situations.I'm not surprised 😉
I don't wish to be negative so please take this constructively.
Thank you for suggestions.
Definitely, I will re do beginning of the tutorial as you suggesting, target curve it is one of the main payers.
Until know tutorial reach a point how should be done by "swissbear" and it is in pdf format. But from know on we just fine tune that tutorial as it should be. And start is "target curve".
I still have a questions about L and R channel things lost same where in original "swissbear" work...but is later about it. First lets do start page about the"target curve".
Last edited:
Edit: JohnPM answered your question after and looking closely at the graph you can see a very slight tilt. The range of the graph is important looking at anything on too wide a scale makes everything look good and hide all the bumps.
In this case with a single stage of EQ the target should be used from the start.
BTW your raw measurement is like the old B+K curve, flat to 1k then tilting down. For me I find that curve to work better when the volume is quite loud.
In this case with a single stage of EQ the target should be used from the start.
BTW your raw measurement is like the old B+K curve, flat to 1k then tilting down. For me I find that curve to work better when the volume is quite loud.
Last edited:
The SPL axis span of your graph is so huge (more than 300 dB) it will be difficult to see slopes of 1 dB/octave. Use a more sensible graph range.Cant repeat the result you got in REW 😕 Change equalizer to Generic not helping.
Post number ? Is his the answer in this thread ?Edit: JohnPM answered your question
Was not my intention to use "makeup" 😀just for sake of example......makes everything look good and hide all the bumps....
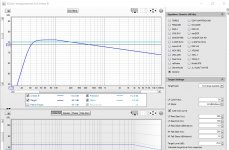
In your picture example target curve LF slope is much steeper ..I have make the same settings and getting very shallow .
Same how I cant repeat it with target settings in my REW.
Have overlapped your picture from over mine .Picture 1
Could t we get the similar result if to import room target curve in REW thru
preferences ? Picture2
This mean target curve should be in a first page of tutorial.In this case with a single stage of EQ the target should be used from the start.
BTW ? old B+K curve ? what is it, how to decode ?BTW your raw measurement is like the old B+K curve, flat to 1k then tilting down. For me I find that curve to work better when the volume is quite loud.
Attachments
Last edited:
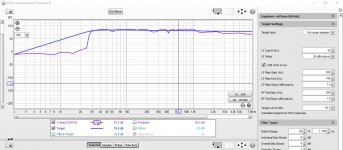
Look at the dB scale on the left of fluid and your graph. You can't overlay these two unless the scale on the left is the same.
On your plot each horizontal line represents 10 dB. On fluid's plot the same lines represent 1 (one) dB!
On your plot each horizontal line represents 10 dB. On fluid's plot the same lines represent 1 (one) dB!
Last edited:
#3191 right above this onePost number ? Is his the answer in this thread ?
It is the scale that is different, in my shot it is in 5dB steps with a range of 30dB in yours the range is over 300dB so it is zoomed out over 10 times as far. Press the plus button in the top left until your scale matches mine and your curve will appear steeper. Edit: wesayso beat me to this one 🙂In your picture example target curve LF slope is much steeper ..I have make the same settings and getting very shallow .
Same how I cant repeat it with target settings in my REW.
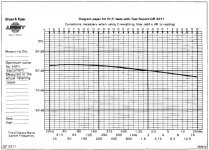
The Bruel and Kajer curve (image attached), my memory was faulty on that one the flat to 1k then tilting down was one of Bob Katz' earlier recommendations. Mitch Barnett has some good information in his Computer Audiophile / Audiophile style articles.BTW ? old B+K curve ? what is it, how to decode ?
A well designed speaker with a flat on axis and listening window response that is relatively conventional in design will have a falling in room response much like these curves.
If the speaker has good directivity then approaching the target backwards like this can be helpful in getting a sound to your liking in room. If the directivity is not so well controlled all bets are off and using this target may well not give the best result.
All of this is covered very well in Flyod Toole's book.
Attachments
Last edited:
Look at the dB scale on the left of fluid and your graph. You can't overlay these two unless the scale on the left is the same.
On your plot each horizontal line represents 10 dB. On fluid's plot the same lines represent 1 (one) dB!
Thank you ,wesayso will correct that mistake. Always grateful for feed back.
The SPL axis span of your graph is so huge (more than 300 dB) it will be difficult to see slopes of 1 dB/octave. Use a more sensible graph range.
Im so sorry, John PM have no idea how have overlooked comment from you. Only one excuse is an age -getting less concentrated

Last edited:
Not all our battles are glorious 😡wesayso beat me to this one 🙂

There is a huge bag off goody's- takes a wile for me to digest. But that is for free time reading don be mist. At the moment would like just finish that tutorial and learn on the way from it.🙂 will take a day or so to make soot out for first pages of tutorial . Have found same discussion about curve there .Thank youThe Bruel and Kajer curve (image attached), my memory was faulty on that one the flat to 1k then tilting down was one of Bob Katz' earlier recommendations.
Mitch Barnett has some good information in his Computer Audiophile / Audiophile style articles.......
All of this is covered very well in Flyod Toole's book.
Last edited:
Would be reasonable to make *.txt file for room curve same thing like this:
31.5 6
40 5.9
50 5.5
63 4.9
80 3.7
100 2.5
125 1.3
160 0.6
200 0.2
250 0
1000 -1
32000 -6
And import file to REW in "Preferences"--> House curve ?
Or that not be the same as to make it in "Target settings" for it in REW "EQ" ?
31.5 6
40 5.9
50 5.5
63 4.9
80 3.7
100 2.5
125 1.3
160 0.6
200 0.2
250 0
1000 -1
32000 -6
And import file to REW in "Preferences"--> House curve ?
Or that not be the same as to make it in "Target settings" for it in REW "EQ" ?
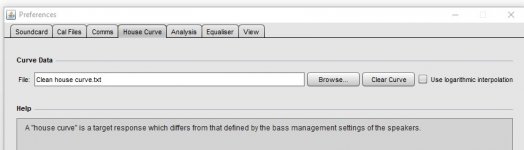
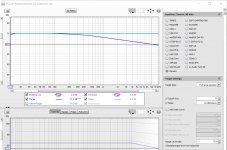
Yes you can do it that way, thumbnail example below showing a BK curve set as "House Curve" in REW, just be sure to untick the add room curve in EQ or you get both combined.
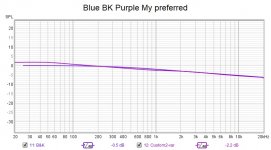
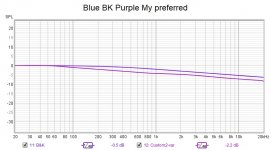
Here is the difference between BK and my preferred curve.

When you adjust the levels to overlap you can see that it is a bass boost and a little more cut here and there, text files attached so you don't need to reinvent the wheel.

I came to mine based on a lot of listening and manually adjusting shelving EQ's. It is amazing how similar these curves are to each other considering when and how there were created 🙂
Here is the difference between BK and my preferred curve.
When you adjust the levels to overlap you can see that it is a bass boost and a little more cut here and there, text files attached so you don't need to reinvent the wheel.
I came to mine based on a lot of listening and manually adjusting shelving EQ's. It is amazing how similar these curves are to each other considering when and how there were created 🙂
Attachments
Thank you fluid 🙂Yes you can do it that way, thumbnail example below showing a BK curve set as "House Curve" in REW, just be sure to untick the add room curve in EQ or you get both combined.
Here is the difference between BK and my preferred curve.
- Home
- Design & Build
- Software Tools
- rePhase, a loudspeaker phase linearization, EQ and FIR filtering tool