Yes I saw that piece, thanks!
I'm realizing that at least some of the info I'm after probably begs a good read of the help files end to end, ........before asking for help on items still not fully understood...
Hi everyone,
Another method for separating the characteristics of the signal produced by the loudspeakers from the noise added by the room is to use some kind of averaging technique.
Here is an academic view on the subject: https://www.researchgate.net/public...esponse_measurement_using_beamforming_methods
I am personally using a different technique, which consists in making 8 measurements at the edges of a parallelepiped (stretched cube), which is containing the listening area. I sometimes add a ninth point which is the center of this parallelepiped and is the sweet-spot. In my case, the parallelipiped is 0.8m wide, 0.4m deep and 0.2m high.
Using either the (A+B)/2 impulse algebra function of REW in case of 8 measures, or simply the A+B function, I add all the impulse responses, after having carefully centered each of the impulses in the time domain to make sure not to have phase errors when adding them.
This way, the noise of the room is considerably decreased and the remaining is the signal averaged at the listening position.
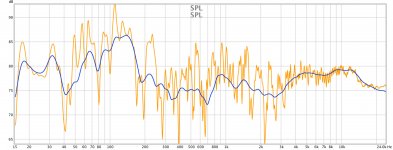
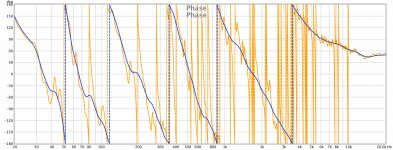
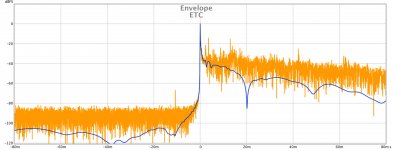
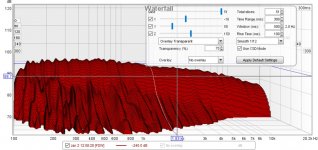
Here are some illustrations. In orange color, the measurement at the sweet-spot in 1/48th octave smoothing, without any Frequency Dependent Window. In blue color, with the exact same parameters, the sum of the 9 measurements, corrected for the amplitude.
You can observe that the phase signal for instance is much cleaner with this technique... On the ETC curve, you will notice that the early reflections of the sweet-spot measurement have been wiped out by the summation/averaging process. This is the reason why the signal is much cleaner.
Another method for separating the characteristics of the signal produced by the loudspeakers from the noise added by the room is to use some kind of averaging technique.
Here is an academic view on the subject: https://www.researchgate.net/public...esponse_measurement_using_beamforming_methods
I am personally using a different technique, which consists in making 8 measurements at the edges of a parallelepiped (stretched cube), which is containing the listening area. I sometimes add a ninth point which is the center of this parallelepiped and is the sweet-spot. In my case, the parallelipiped is 0.8m wide, 0.4m deep and 0.2m high.
Using either the (A+B)/2 impulse algebra function of REW in case of 8 measures, or simply the A+B function, I add all the impulse responses, after having carefully centered each of the impulses in the time domain to make sure not to have phase errors when adding them.
This way, the noise of the room is considerably decreased and the remaining is the signal averaged at the listening position.
Here are some illustrations. In orange color, the measurement at the sweet-spot in 1/48th octave smoothing, without any Frequency Dependent Window. In blue color, with the exact same parameters, the sum of the 9 measurements, corrected for the amplitude.
You can observe that the phase signal for instance is much cleaner with this technique... On the ETC curve, you will notice that the early reflections of the sweet-spot measurement have been wiped out by the summation/averaging process. This is the reason why the signal is much cleaner.
Attachments
Last edited:
That's indeed a good way to separate the sound of the speakers from the noise floor.
If I recall Mitch has a chapter on that in his ebook?
If I recall Mitch has a chapter on that in his ebook?
Last edited:
That's indeed a good way to separate the sound from the speakers from the noise floor.
If I recall Mitch has a chapter on that in his ebook?
Hi Wesayso,
Yes you are right. He has a chapter on Beamforming, but a different one, based on the axis orthogonal to the LS axis, in order to respect the measurement symmetry which is key for Acourate. Although he does not seem to be a big fan of that, as he has the conviction that Acourate has a better algo to calculate the correction from a single measurement at the listening position.
In my experience, and with difficult loudspeakers (like wide-band Voxativ Zeth), this has not been the case, and I reached a much more pleasant listening environment with REW/rePhase and the averaging technique.
So it's pretty much up to everyone to decide what is worth for him/her. But I thought it was worth sharing 😉
The beam forming measurement method I used is attached. It is a delay sum technique, which I found to work very well for suppressing midrange and high frequency reflections.
There is a chapter on it in my eBook that goes into the measurement detail with before and after comparisons - it is quite a significant difference and works as advertised. However, it is effort as it requires one to take 10 measurements moving along the beam form, which took me about 2 hours to complete.
From a subjective listening point of view, it really cleaned up the midrange and high frequency imaging - sounded clearer and less diffuse. This is in comparison to a single measurement correction, switching back and forth in JRiver's convolution engine.
The conclusion I came to was I could not decide which one I preferred better. I ended up preferring AcourateFLOW for fixing the stereo phantom center when Ronald suggested I have a look at Pano's thread on http://www.diyaudio.com/forums/multi-way/277519-fixing-stereo-phantom-center.html
As far as single versus multiple measurements to produce a correction. I have tried both methods, several times, with various software packages, first starting with Audiolense. My findings have been that a single measurement at the LP seems to work fine in my setup. I have measured around my couch area (6ft x 2ft grid area) and the response is just as even 30 degrees off axis as it is on axis with a predictable reduction in dB, but evenly across the frequency range. I attribute that mostly to the constant directive waveguides I use for 1 kHz on up and no XO lobing issues.
Given how powerful most of these DSP software tools are, it comes down to how they are used and what one's listening preferences are.
Attachments
Thank you Mitch for pointing to Pano's idea.
I have to admit I didn't have a clue what the Pano Phase Shuffler was in the rePhase Phase EQ prefix.
I will give it a try 🙂
I have to admit I didn't have a clue what the Pano Phase Shuffler was in the rePhase Phase EQ prefix.
I will give it a try 🙂
The conclusion I came to was I could not decide which one I preferred better. I ended up preferring AcourateFLOW for fixing the stereo phantom center when Ronald suggested I have a look at Pano's thread on http://www.diyaudio.com/forums/multi-way/277519-fixing-stereo-phantom-center.html
Hi Mitch,
I had a try and was very impressed by the results on my system in terms of widening of the sweet spot. Thanks to you for pointing at it, and thanks to Pano for discovering this in the first place and animating a thread on this 😉
What part did you try? I agree, it is a fun thread and made me run several tests.
The "Ronald" in Mitch's post would be me 🙂. We talked about it trough PM as I was getting pleasing results due to the tests done triggered by that thread from Pano.
I do not run phase shuffling anymore, but kept some other ideas from that thread and changed my ambient recipe to fit within that theory. The cross talk in stereo is real and with some help you can improve on it.
Hi Wesayso,
I tried phase shuffling with rePhase 'Pano Phase Shuffler' and found it very interesting.
Thanks to you too then. Glad you cemented the whole team together 🙂
Do you have alternative ideas you would like to share and which would go in the same direction ?
Thanks in advance 🙂
What part did you try? I agree, it is a fun thread and made me run several tests.
I tried phase shuffling with rePhase 'Pano Phase Shuffler' and found it very interesting.
The "Ronald" in Mitch's post would be me 🙂. We talked about it trough PM as I was getting pleasing results due to the tests done triggered by that thread from Pano.
Thanks to you too then. Glad you cemented the whole team together 🙂
I do not run phase shuffling anymore, but kept some other ideas from that thread and changed my ambient recipe to fit within that theory. The cross talk in stereo is real and with some help you can improve on it.
Do you have alternative ideas you would like to share and which would go in the same direction ?
Thanks in advance 🙂
Earlier in the thread (http://www.diyaudio.com/forums/mult...on-eq-fir-filtering-tool-141.html#post4920173), I pointed out to an empirical method of spatial averaging of measurements, which I felt had virtues compared to smoothing.
These virtues are IMHO:
Hope this helps.
Happy holidays to everyone 🙂
These virtues are IMHO:
- It makes it possible to have an amplitude curve which eliminates the specificities of the central measurement point where a single measurement would be made and hence to reduce the effects of the comb filtering which results from the interference between the direct waves emitted by the two loudspeakers and the early reflections. It is clear from the curves, and I tried to illustrate it with the curve of ETC in particular which shows that the early reflections are well erased by the spatial averaging
- It makes it possible to have a phase curve almost directly readable, and which only includes stable reflections. I therefore rely on this phase curve without editing to make my corrections, avoiding just to touch the very low frequencies (generally a phase rotation towards 50Hz, which is the consequence of the intrinsic high-pass filter of the loudspeaker (or the curve of the woofer that serves it) or the high-pass that I put up myself).
- It finally makes it possible to use all the temporal information contained in the measurements, since no smoothing is done on time windows. We use the curves with the full measure, without windowing of any kind.
Hope this helps.
Happy holidays to everyone 🙂
What measurement software have you been using to do this? If I average several measurements in REW I don't seem to be able to create a phase trace for the result.. Does anyone know if there is a way to do this or maybe I am doing something wrong?!
What measurement software have you been using to do this? If I average several measurements in REW I don't seem to be able to create a phase trace for the result.. Does anyone know if there is a way to do this or maybe I am doing something wrong?!
You need to use the impulse algebra functions of REW (not the average calculation of the amplitude responses). Go to the All SPL tab and use (A+B)/2 function to average. Do not forget to adjust the impulses in the time domain prior to doing such calculations.

Aha! I see that now, thanks.You need to use the impulse algebra functions of REW (not the average calculation of the amplitude responses). Go to the All SPL tab and use (A+B)/2 function to average. Do not forget to adjust the impulses in the time domain prior to doing such calculations.
You need to use the impulse algebra functions of REW (not the average calculation of the amplitude responses). Go to the All SPL tab and use (A+B)/2 function to average. Do not forget to adjust the impulses in the time domain prior to doing such calculations.
Would it not be safer to use A + B rather than (A + B / 2)?
Adding the third mic position to an average of the first 2 mic positions would otherwise weight the third position as 1/2 the total rather than 1/3 of the total? Each successive mic position would be weighted as 1/2 the total of the previous group. An outlier in the final mic positions would have undue impact.
I have been using A + B for averaging. The SPL level increases as a result of each addition, but that has no influence on the final SPL response shape or the phase response shape. [The SPL level can easily be reduced back down to match the true average level if desired. Avg SPL = Sum of N SPL's - (20 * Log N) so a sum of 9 measurements would be reduced by ~19 dB]
As a practical matter, this is likely not a significantly difference in most cases. The results may be very similar in most all real data sets. I just think it is more correct and just as easy to use A + B for the calculation in case there is a data set that is significantly impacted.

Averaging, using (A+B)/2, probably is the best way to go if you have 2^n measurements, in this case 8 measurements. You will not face any weighing issues in this case.
Otherwise, you can sum and you will be fine using the method of jtalden too.
I did not notice any practical difference between the two options.
Otherwise, you can sum and you will be fine using the method of jtalden too.
I did not notice any practical difference between the two options.
The /n part is a constant that is transformed to an other constant. Who cares about that constant other when overlaying.
I also wonder about the
I also wonder about the
By using the difference in length from speakers to mic? Change in HF response can effect the peak of the time responce.after having carefully centered each of the impulses in the time domain to make sure not to have phase errors when adding them
Last edited:
Hi all,
been trying to learn the workflow between Rephase and REW, and admittedly finally learn REW in general.
Until recently, I've been using Rephase manually with measurements made with Smaart, and have been pretty happy with results..
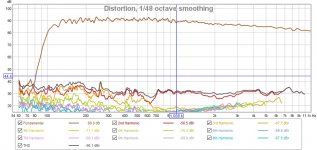
But REW seems to offer more ways of looking at the data, particularly in regard to cleaning up the impulse and step response...as well as measuring distortion, etc. And most importantly, it's more a language this forum uses 🙂
I'm working on a live-sound box, the Peter Morris DIY 60 found on soundforums. It's a 3-way horn loaded double 12" mid, and a BMS 4594HE coax CD.
I'm not at all concerned with in-room performance, and all measurements are made as reflection free as possible. Pattern control substitutes for the "room". The box is for 100 Hz up....and crosses at 650Hz and 6300Hz.
I've followed the recent advice on how to use REW's auto EQ capability for export to Rephase, and built some new FIR filters.
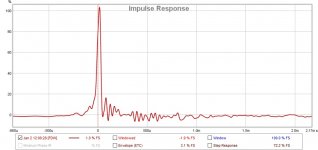
In line with Wesayso's advice to start with the impulse response, here's what I've got so far... first image below....
(btw, Ron, I went through the whole 2-towers thread as a primer on how to use REW...awesome project, super results, and gracious sharing of info..congrats and thx!)
A few questions regarding the impulse plot:
%FS is above 100%...how so? ("Plot responses normalized' is checked..)
The peak of the impulse is about 18 u sec off of where REW's 'Estimate IR Delay' puts it.... why so?
If I shift t=0 manually in experimentation, I read in the help file that the 'System delay' as shown in the 'Measurement info window' should shift by said amount...it doesn't...am I misunderstanding help?
How do I figure out what the two patches of 'fuzz' after the impulse peak, are telling me ? (The first patch right after peak centered at about 130u, and the next centered around 500u.)
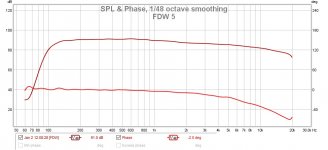
OK, SPL and phase next....
I got more SPL roll off from 1000Hz than I wanted, but I know how to fix that. (used default 1.8dB slope ...will move to 1.2 next build..)
What I can't find a way to fix is the phase rolloff on the high end.
I can get perfectly flat phase in Rephase, but measurements always roll off.
It seems to do with how REW determines t=0 again..
For instance, if I take the FIR file behind the phase graph below, and shift it 15 u sec in rePhase, the predicted curve is flat as a pancake.
But new measurement stays the same, as far as the rolloff...????
Nothing I do seems to be able to bring the phase rolloff up...
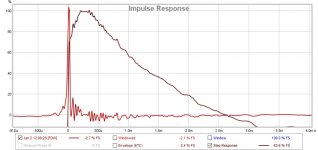
Last plot for now, step response....
don't want to wear out welcome asking too many questions 😱
What causes the step to first rise after the impulse peak, taking about 200 u sec to hit 100% and then start falling? The first batch of 'fuzz' again?
I do thank all for any help given here...
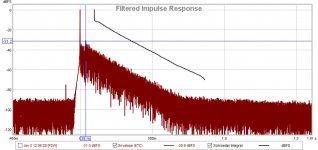
I've attached further graphs if they can assist...
been trying to learn the workflow between Rephase and REW, and admittedly finally learn REW in general.
Until recently, I've been using Rephase manually with measurements made with Smaart, and have been pretty happy with results..
But REW seems to offer more ways of looking at the data, particularly in regard to cleaning up the impulse and step response...as well as measuring distortion, etc. And most importantly, it's more a language this forum uses 🙂
I'm working on a live-sound box, the Peter Morris DIY 60 found on soundforums. It's a 3-way horn loaded double 12" mid, and a BMS 4594HE coax CD.
I'm not at all concerned with in-room performance, and all measurements are made as reflection free as possible. Pattern control substitutes for the "room". The box is for 100 Hz up....and crosses at 650Hz and 6300Hz.
I've followed the recent advice on how to use REW's auto EQ capability for export to Rephase, and built some new FIR filters.
In line with Wesayso's advice to start with the impulse response, here's what I've got so far... first image below....
(btw, Ron, I went through the whole 2-towers thread as a primer on how to use REW...awesome project, super results, and gracious sharing of info..congrats and thx!)
A few questions regarding the impulse plot:
%FS is above 100%...how so? ("Plot responses normalized' is checked..)
The peak of the impulse is about 18 u sec off of where REW's 'Estimate IR Delay' puts it.... why so?
If I shift t=0 manually in experimentation, I read in the help file that the 'System delay' as shown in the 'Measurement info window' should shift by said amount...it doesn't...am I misunderstanding help?
How do I figure out what the two patches of 'fuzz' after the impulse peak, are telling me ? (The first patch right after peak centered at about 130u, and the next centered around 500u.)
OK, SPL and phase next....
I got more SPL roll off from 1000Hz than I wanted, but I know how to fix that. (used default 1.8dB slope ...will move to 1.2 next build..)
What I can't find a way to fix is the phase rolloff on the high end.
I can get perfectly flat phase in Rephase, but measurements always roll off.
It seems to do with how REW determines t=0 again..
For instance, if I take the FIR file behind the phase graph below, and shift it 15 u sec in rePhase, the predicted curve is flat as a pancake.
But new measurement stays the same, as far as the rolloff...????
Nothing I do seems to be able to bring the phase rolloff up...
Last plot for now, step response....
don't want to wear out welcome asking too many questions 😱
What causes the step to first rise after the impulse peak, taking about 200 u sec to hit 100% and then start falling? The first batch of 'fuzz' again?
I do thank all for any help given here...
I've attached further graphs if they can assist...
Attachments
- Home
- Design & Build
- Software Tools
- rePhase, a loudspeaker phase linearization, EQ and FIR filtering tool