You should verify your settings, the impulses looks flabby 😀Filtered wave shapes
Found the tutorial but in French is that right is there one in English?
Dropbox - REW_rePhase_tuto.pdf
This is in English, also Mitch linked to another walkthrough on the Computer Audiophile site a few posts back.
I could and was about to and then I saw thisNot bad, could you filter it at 60Hz or 100Hz ?
You should verify your settings, the impulses looks flabby 😀
Maybe that is a joke that doesn't translate well into English but it doesn't make me want to take the time to post the data that you asked for if that is your response to someone that did.
Yes, if you read the linked paper from JJ on acoustics and psychoacoustics, it is the first arrival timbre that our ears care about most.
I I'm a fond believer in the EBU (European brodcaster union) spec. Early reflections inside 15 ms matters and should be under -15dB in ETC curves.
Not to michba:
I will try staying at topic but it is not easy with all the blurbs here lately.
Why insulting other world class system owners beacause you have a world class system yourself?
I did my averaging left to right rather than in a line towards the speaker as my speaker changes response more with distance than other's do and also I was aiming to get a balanced correction across my listening area.Hi fluid, cool. Yes, I did similar using the beamforming technique and moved the mic in 10 cm increments moving forward and back from the LP for 10 measurements in total. Does do a great job of suppressing the room and have similar ETC's like yours. Still considering if I like the sound versus a single measure. Some say that the multiple measurements also helps average the low frequency response and others say that for some DSP correction software, the averaging is built-in to the psychoacoustic filter...
I think with the averaging it depends on the strength of the filter that is created as to whether it sounds different or not vs single position. My average frequency response looks very similar to the single central position but the ETC is quite different. My template has longer windows at top and bottom which are too much for a base measurement that has a lot of room sound in it.
It would interesting if you could import your correction filter impulse into REW to see how "strong" it is as that might give a clue as to why you found less difference.
I also don't use the psychoacoustic target stage in DRC which could also be part of it.
Because the low frequency response is dominated by room modal behaviour the average was most similar in that range, the REW room simulation was a very good predictor of the best positions for the speakers from a bass perspective.
Nothing wrong with that but it does require a reasonable amount of room treatment which not everybody is willing or able to use.I I'm a fond believer in the EBU (European brodcaster union) spec. Early reflections inside 15 ms matters and should be under -15dB in ETC curves.
Getting the best out of the situation you are in seems sensible to me, use the tools you have available.
For myself I am not in any way trying to promote line arrays or run down multi way systems. Both have positives and negatives that are fairly well documented. You are the one that has been asking questions about line arrays and phrasing it in a way that sounds negative. It is hard not to respond to those kinds of posts. I have both a line array and a couple of good examples of a multiway loudspeaker so in that sense I am in a good position to compare. I like both for different reasons.Not to michba:
I will try staying at topic but it is not easy with all the blurbs here lately.
Why insulting other world class system owners beacause you have a world class system yourself?
None of that has anything to do with rephase but the processing and measurement of my speakers does which is why I have posted it here.
.....I will try staying at topic but it is not easy with all the blurbs here lately.
Why insulting other world class system owners beacause you have a world class system yourself?
 ...Is it blurbs share prescription and results on domain meant to help each other using Rephase either as primary or secondary helping tool and how can that at all insult other owners.
.....Any other volunteers showing their IR results at the listening position?.....
Forget it ...😀
Well showing off perfect curves and state or indicate that they are needed to look good to sound good is insulting, at least to me that don't hear phase distortion inside reasonable limits.
So phase distortion will make phase and time curves look bad but it can sound good.
And non averaged off axis measurements are not shown. I believe they matters. That is why we use LR filters. And it is why sharp filters can be dangerous.
And that IS relevant to Rephase use and end result analysis
I I'm a fond believer in the EBU (European brodcaster union) spec. Early reflections inside 15 ms matters and should be under -15dB in ETC curves.
Not to michba:
I will try staying at topic but it is not easy with all the blurbs here lately.
Why insulting other world class system owners beacause you have a world class system yourself?
torgeirs, I am a fond believer of EBU 3276 as well: https://tech.ebu.ch/docs/tech/tech3276.pdf My reproduction system mostly meets the spec, but I am a bit outside of the reverb/decay spec in my room as it has very little acoustic treatment and quite live. But my early reflections are down at -20 dB as measured in ETC curves for the first 20ms and beyond. But the more I interpret the research from JJ, Toole and others, I am not so sure anymore... TBD.
I am not sure how you interpret my posts as being insulting as that is not my intent.
I did my averaging left to right rather than in a line towards the speaker as my speaker changes response more with distance than other's do and also I was aiming to get a balanced correction across my listening area.
I think with the averaging it depends on the strength of the filter that is created as to whether it sounds different or not vs single position. My average frequency response looks very similar to the single central position but the ETC is quite different. My template has longer windows at top and bottom which are too much for a base measurement that has a lot of room sound in it.
It would interesting if you could import your correction filter impulse into REW to see how "strong" it is as that might give a clue as to why you found less difference.
I also don't use the psychoacoustic target stage in DRC which could also be part of it.
Because the low frequency response is dominated by room modal behaviour the average was most similar in that range, the REW room simulation was a very good predictor of the best positions for the speakers from a bass perspective.
fluid, I have looked at the correction filter impulses before, but has been a while and I will check again between the single and multiple to see what differences are there. For sure the ETC is quite different for both, especially in mid and high frequencies.
From what I can tell, for some DSP software, the psychoacoustic filter limits how much bass amplitude is corrected by not completely filling in the dips or nulls at the single measurement position. I also notice that the psychoacoustic filter follows the upper envelope of the original magnitude response and this new spectral envelope is what is used for the correction. Anyway, off topic here. My apologies.
None of that has anything to do with rephase but the processing and measurement of my speakers does which is why I have posted it here.
OK, so it is just a promoting of rephase capabilities on line array correction.
It is a little hard to see when measurements are of DRC prosessed or non prosessed arrays. Or is some of the measurements just rephase prosessed?
Sorry for sounding negative. It's meant to sound critical.
(I have learnt most of the critical voices in here, enough
 as it is.)
Well showing off perfect curves and state or indicate that they are needed to look good to sound good is insulting, at least to me that don't hear phase distortion inside reasonable limits.
So phase distortion will make phase and time curves look bad but it can sound good.
And non averaged off axis measurements are not shown. I believe they matters. That is why we use LR filters. And it is why sharp filters can be dangerous.
And that IS relevant to Rephase use and end result analysis
torgeirs, I think there may be some misinterpretation of what I am saying with respect to time alignment of drivers using linear phase digital XO and phase distortion.
I am also happy to show 14 non-averaged measurements across the 6' x 2' couch area I mentioned before. All of which is in my eBook linked below, but happy to send those off axis responses to you via PM.
Measuring closer to the speaker and/or using measurement gating will help you get a more usable phase reading.Hi,
Everyone I am new to using the rePhase software for the first time. I will outline what I have and generated and many questions to ask but limit to asking what I need to know first.
Speakers: 2 way open baffle(similar to LX Mini, cross at 750Hz)
Equipment: MinidspHD 2*4 way
Software:REW via Umik and Rephase
I generated a x-over at 750Hz Using LR 2nd order, then I used the REW to equalise the output to relatively flat. I downloaded to Rephase software and was I unable(due lack of knowledge of rePhase) to make the phase flat. Attached is my freq response and phase outputs, I would appreciate for advice on how to make the phase as flat as possible.
Questions:
1. the Rephase sequence/steps I should be considering to equalise the phase for any output response?
2. What curve smoothing should I use normally?
You don't want to correct the abrupt phase shifts caused by reflections comb filtering, so you have to be able to ignore them when analysing the measurement.
If you are building your crossover from scratch using FIR filters, the job is in fact easier than building a minimum-phase crossover and then linearising its phase.
And of course what you want is a linear-phase acoustical crossover, so electric filters are only part of the equation.
Here is a small step by step tutorial on how to do this:
http://www.diyaudio.com/forums/mult...on-eq-fir-filtering-tool-131.html#post4892944
(for some reason I could not find my original post??)
Yes, sorry about that.Rephase is a powerful software and maybe due to lack of documentation(text and video) I cannot really get a full understanding on how to to use it effectively.
I am toying with the idea of publishing a few tutorial videos, but this might take time...
Dropbox - REW_rePhase_tuto.pdf
This is in English, also Mitch linked to another walkthrough on the Computer Audiophile site a few posts back.
Thanks...will read it and come back again with more queries.
I think you have completely misunderstood the point and intention of showing some of the graphs and perhaps because of that not really read the text that goes with them. There is no need to have a perfect looking impulse to get good sound. There are plenty of good sounding speakers that have awful impulse and step responses it is by no means critical to good sound.Well showing off perfect curves and state or indicate that they are needed to look good to sound good is insulting, at least to me that don't hear phase distortion inside reasonable limits.
So phase distortion will make phase and time curves look bad but it can sound good.
Phase distortion as a term is not something I am trying to avoid and it can be very difficult to hear the difference between an IIR crossover and one that has the same slope but in linear phase. That does not mean that phase is unimportant or that any changes in phase are also inaudible.
What I have tried to do is realign the phase of the speaker at the listening position so it resembles the minimum phase of the frequency response at that point. The most important part of that is in the modal region below 200Hz. Changing phase in that region has a much more audible effect and I view it more as getting correct time alignment of all the frequencies.
With a multiway speaker you could do the same with physical means. By using multiple subwoofers and equalizing them with basic IIR EQ and delay you could get similar looking graphs or probably even better (in the modal region) where the bass frequencies arrive at the same time as the rest (within reason)
I can tell you that the prettiest looking graphs do not always sound the best. It depends on what was used to get there. But they can be used as a guide to what changed and try and learn from that in the future. Targeting a ruler straight frequency and phase response does not work for me. Trying to get a "perfect" correction through complete inversion does not work either. But with enough work and listening you can get a nice looking graph that sounds as good as it looks.
I don't have any to share unless I go to the trouble of convolving the same filter with each of my individual measurements. When I move across my couch from left to right I don't hear much difference in sound so for myself I am happy that it works well enough in my application.And non averaged off axis measurements are not shown. I believe they matters.
It is a little hard to see when measurements are of DRC prosessed or non prosessed arrays. Or is some of the measurements just rephase prosessed?
I am using rephase for a little bit of linear phase EQ and some gentle excess phase correction. I do intend to try as an experiment using rephase to do all the phase correction manually at some point.
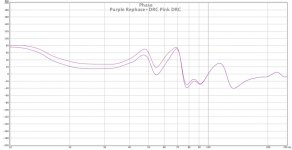
This is the difference in phase of my DRC filter and the filter after rephase it is only below 100Hz. It doesn't look like much but it does sound better. More impact on kick drums a little bit less polite. This change makes it track the minimum phase more closely which was my aim.
It is very easy to be critical for the sake of it, it is much harder to give positive criticism that is actually helpful.Sorry for sounding negative. It's meant to sound critical.
(I have learnt most of the critical voices in here, enough
For myself if I say or write something that is wrong or someone else has a different opinion on I am happy to hear it, but picking things apart without offering any sort of alternative solution is what is worst about internet forums.
Maybe one day you will start a thread about your speakers with some pictures and graphs so we can learn what is good in your system. Who knows maybe you will inspire someone else.
Attachments
Not to michba:
I will try staying at topic but it is not easy with all the blurbs here lately.
Why insulting other world class system owners beacause you have a world class system yourself?
If this is at any way aimed at me, I'm sorry you feel that way.
I don't recall classifying my setup as a world class system, quite frankly I lack the experience to do so. I wouldn't even call my system HiFi, it's more: My-Fi.
I aim to please myself and had specific goals in mind. Audibility of phase being one of them.
Like Mitch, I concentrated on that first wave front that hits the ears. In fact, I've learned a lot from Mitch's writings on the subject of DSP. It gave me a head start. There are many more members here that I learned from and I try to pass it forward to anyone that likes to try too.
I will never say: do as I do. That's up to anyone to decide for themselves. It's more like: If you want to know what I did, what I've learned and what worked for me, I can help you with that. Pretty graphs were never the sole goal to reach. I do use ears for that. What I often warn for is not to force any DRC correction. That probably won't work or sound right, even if the graphs do look pretty.
So don't feel insulted on my account. I do not know much about it even though I would be interested. I doubt you are looking for any more measurements from my setup so I won't dare post the off axis results. Not unless you ask for them to me personally on my thread.
Can we move on now and help each other and try to reach (some of) the goals we are after? That's what DIYA is about for me. Without people like Mitch, BYRTT, Pano, pos, JohnPM, gmad, jim1961 and many many more I wouldn't be where I am today; happy with the sound I have, eager to learn even more about it.
Hi everyone,
Another method for separating the characteristics of the signal produced by the loudspeakers from the noise added by the room is to use some kind of averaging technique.
Here is an academic view on the subject: Enhancement of loudspeaker impulse response measurement using beamforming methods
I am personally using a different technique, which consists in making 8 measurements at the edges of a parallelepiped (stretched cube), which is containing the listening area. I sometimes add a ninth point which is the center of this parallelepiped and is the sweet-spot. In my case, the parallelipiped is 0.8m wide, 0.4m deep and 0.2m high.
Using either the (A+B)/2 impulse algebra function of REW in case of 8 measures, or simply the A+B function, I add all the impulse responses, after having carefully centered each of the impulses in the time domain to make sure not to have phase errors when adding them.
This way, the noise of the room is considerably decreased and the remaining is the signal averaged at the listening position.
Here are some illustrations. In orange color, the measurement at the sweet-spot in 1/48th octave smoothing, without any Frequency Dependent Window. In blue color, with the exact same parameters, the sum of the 9 measurements, corrected for the amplitude.
You can observe that the phase signal for instance is much cleaner with this technique... On the ETC curve, you will notice that the early reflections of the sweet-spot measurement have been wiped out by the summation/averaging process. This is the reason why the signal is much cleaner.
This is the way I intend to try to do it, as well.
Would adding frequency-dependant-windowing on top of this be of any use, you think?
This is the way I intend to try to do it, as well.
Would adding frequency-dependant-windowing on top of this be of any use, you think?
The FDW technique is useful but removes information, as opposed to spatial averaging (the technique exposed here) which is adding information. I therefore suggest you start with spatial averaging and see if you have a clear enough signal to avoid using spectral averaging (smoothing).
Pls note that since the post, REW has evolved and now proposes some additional functions which are useful. You can refer to this howto in case: REW_rePhase_tuto.pdf
- Home
- Design & Build
- Software Tools
- rePhase, a loudspeaker phase linearization, EQ and FIR filtering tool