You are right about the cathode decoupling, with the tube it is about 7Hz -3dB but measured with a functiongenerator alone and 550Ω source impedance it is about 3-4 Hz.
Anyway i don't like to measure with an amplifier which is not capable of 1Mhz because if there is any ringing you won't see it.
Anyway i don't like to measure with an amplifier which is not capable of 1Mhz because if there is any ringing you won't see it.
Last edited:
At such a high frequency, any OPT goes bonkers...
Most transformers will indeed but you can avoid it till 1MHz (not mine because it's 4Ω & 8Ω and not the single output version). Or a good interstage 1:1 can do better.
source 1200Ω

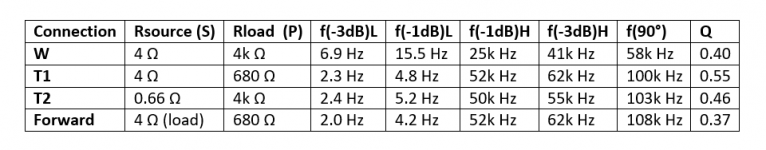
@Jazbo8: I just did the forward measurement, as it is a really quick one. I used a source resistor of 680 Ohms driven from my signal gen, and loaded the transformer with 4 Ohms. I have added a row to the table with the results of the forward measurement, I have attached the new table.
The -3dB, -1dB points are found the same way as before, by taking the AC transfer ratio at 1 kHz as the 0 dB reference point. So it always measures the transfer ratio relative to the ratio at 1 kHz, not the level. in this way, absolute level is not critical. I set my generator at full output, 20 Vpp or 7.07 Vrms.
It is interesting to see that the LF -3dB point has lowered beyond measurement error. HF -1dB and -3 dB remained the same, but the 90 degree point and the associated Q have also shifted a bit.
I will now begin with fixing my PSU.
Attachments
@Jazbo8: I just did the forward measurement, as it is a really quick one. I used a source resistor of 680 Ohms driven from my signal gen, and loaded the transformer with 4 Ohms. I have added a row to the table with the results of the forward measurement, I have attached the new table.
.
That is an acceptable way to predict HF bandwidth (influence of stray capacitance).
To check LF bandwidth and maximum LF power (core saturation), another measurement setup is needed.
Absolutely! Post 91 shows clearly how the primary effective inductance is level and bias dependent, as can also be seen from the magnetization curve I presented in that post. In order to measure the LF response, you need to apply the correct bias and measure at realisic level. This measurement was done with no bias and very low signal level.
BTW, I just fixed my lab PSU, but I am calling it a day...
BTW, I just fixed my lab PSU, but I am calling it a day...
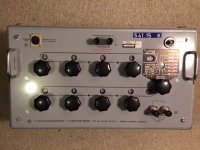
Nice boat anchor! Seriously, R&S gear has always been fancy stuff.This thing can measure inductance with DC current applied, but I am not sure if it accepts high AC voltage to mimic primary AC swing.
Very heavy, would need a permanent place on the bench.
An SE transformer has a air-gapped core in order to increase the amount of energy stored in the magnetic field at a given field strength. It reduces the inductance and linearizes the magnetization curve, but the magnetic circuit still mostly consists of iron, and thus can be saturated. Look at my magnetization curve from post 91, there you can clearly see the core entering saturation. At low frequencies, the magnetization is excited enough to make saturation occur.What you mean with core saturation? It's a SE transformer.....
Saturation is not a "brick wall" you bump into. In another thread, I wrote this about it:
An air gap linearizes the magnetic properties, because the magnetic properties of the gap are linear. It has the effect of making the saturation corner a bit sharper, but the process still starts out in the origin.
It is important not to think of saturation as a point on a curve, but as a process. It starts as soon as the core becomes magnetized, and as the core is magnetized further, its effects become more pronounced. The "saturation point" in your particular application is the point where you decide that the changes in the inductor's properties start to become excessive.
An air gap linearizes the magnetic properties, because the magnetic properties of the gap are linear. It has the effect of making the saturation corner a bit sharper, but the process still starts out in the origin.

Emphasis mine...I know.
For me it looks pretty strange that for a SE transformer there could be a "saturation" problem because in a good designed transformer the core isn't the problem, first the output tube run out of current.
True, but isn't the idea of characterization to see if a transformer really performs like it is supposed to?
Speaking of characterization, while seeing the frequency response is useful, it does not tell us enough about the transformer parameters...
to timpert
I have seen your job.
I am preparing an answer about your tests.
I have seen that the backward and forward config. gave the same results ( with a% of difference reasonable) and it is very good.
The main test missing is THD vs frequency, it is very important in my opinion.
Ciao for the moment
Walter
I have seen your job.
I am preparing an answer about your tests.
I have seen that the backward and forward config. gave the same results ( with a% of difference reasonable) and it is very good.
The main test missing is THD vs frequency, it is very important in my opinion.
Ciao for the moment
Walter
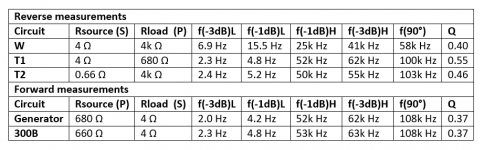
Final measurement with 300B
I have done the forward measurement with a 300B tube, and added the results to the table. I have traced the tube's characteristics with my uTracer, and found the following properties:
Va = 250 V
Vg = -45.0 V
Ia = 74.6 mA
gm = 5.5 mA/V
Rp = 660 Ohms
mu = 3.6
The plate voltage is a bit low for a typical 300B operating point, but I chose this point because it was within the capabilities of my uTracer. It goes down to -50 Volts on g1. The resulting Rp is normal for a typical 300B output stage.
From the reverse measurements, the T1 connection matches the forward results best, the differences are negligible except for the 90 degree point. The forward measurement on the function generator nailed that aspect. The rise of the -3 dB point to 3 Hz that I expected did not occur.
The conclusion...
Measurement of the frequency response with the OPT reverse connected is feasible, the most representative results are obtained when the secondary is driven from a source with a series resistor equal to the rated secondary load impedance, and the primary is loaded with a resistor that is equal to the driving tube's internal plate resistance (T1 circuit). The disadvantage of this method is that the transformer cannot be driven to full voltage without overloading it.
When the secondary is driven with the driving tube's plate resistance transformed through the impedance transformation ratio and the primary is loaded with the transformer's rated plate load resistance, the transformer can be driven to full voltage. This connection is thus better for distortion measurement. However the resulting measured frequency response is slightly less accurate. And stay away from the transformer's LF -3dB point at full power, if you don't want to fry the driving amp.
When the primary is loaded with the transformer's rated plate load, the transformer appears to perform significantly worse than it actually does in-circuit. This result confirms what I said in post 30, and is in line with the simulation results of post 35.
For the nitty-gritty details of the HF behavior at the extremes of the passband, the reverse measurement loses accuracy regardless of the circuit used. But the forward measurement with the generator matches actual performance perfectly. This is not relevant when no global feedback is used, but when feedback is used, the exact behavior of the HF rolloff becomes highly relevant for loop stability.
The measurements thus prove my point beyond any doubt. In that sense, I am done. I'd also like to figure out the distortion performance, but that will have to wait until a later time.
Attachments
Waltube said:
Yes it is, and probably even more interesting would be the distortion spectrum at selected frequencies and levels, with and without bias. I'll try to do that as well, but don't hold your breath, as I have a lot of other things to do...The main test missing is THD vs frequency, it is very important in my opinion.
For the nitty-gritty details of the HF behavior at the extremes of the passband, the reverse measurement loses accuracy regardless of the circuit used. But the forward measurement with the generator matches actual performance perfectly.
The measurements thus prove my point beyond any doubt. In that sense, I am done. I'd also like to figure out the distortion performance, but that will have to wait until a later time.
The forward measurement of HF behavior with generator matching actual performance is perfectly in line with my experience (#106).
With respect to distortion measurement, I guess the most interesting is the influence of core saturation. Output transformers working within their margins have very low distortion; other sources of distortion likely dominate.
@waltube: already some months ago 🙂() you introduced a litz wire transformer, with claims about distortion when I remember well. You promised a second sample as your first one had some restrictions, but the new sample did not show up until now. Can we expect something in that direction when you tell us something about transformer distortion??
Sorry if I was not clear... My comment was intended for melkert and perhaps Walter, your posts showed all the important transformer parameters, which is what characterization is about. Key data such as primary inductance, leakage inductance, turns ratio, primary and secondary DCR, and shunt capacitance, etc. can tell us a lot about the transformer, and allow us to build relatively accurate Spice models.Which parameters do you want to know?
Thank you for sharing your work and confirming that the theory and simulation results fit together pretty well as they should.

- Home
- Amplifiers
- Tubes / Valves
- OPT Characterization