I don't know which type of generator you have, if it is capable to generate a great swing with a THD = 0,0 ...something it is ok but it is very hard to have.
In Audioreview is planned in the future to test a Fet amp generator with a nominal Vout of about 200 vrms with a very low distortion.
Please... OPT Characterization
Last but not least... which amplifier are you using to drive secondary winding of trafo under test?
Describe all your setup carefully, so we can arrange something similar. Till now only some graphs...I hope that some readers of this thread can test the trafo with the method I have described and then send the opinion about this.
I have read the post, but is not specified the type/model/brand of generator.
Then , you can drive the secondary with a good ss amp; an amp that can delivery around 20 watt rms/ 8 ohm ( 12,5 volt) can be enough
About the measurement with our method, on post 1 you can see the schematic of test set and is not so difficult to understand the way.
In every case:
first of all you need a good vac voltmenter, then a signal generator to drive the ss amp.
You can omit the bias current.
In addition with Visual analyzer software you also can check the THD vs frequency and, of course, the frequency answer.
It is very important to connect the right value of resistance on secondary (acting as primary) and on primary (acting as secondary) and them are related to the tech specs of the trafo.
The R on on primary (as secondary) must have a partitor so you can take a test signal to send on test set or an a Voltmeter; normally is 40 dB attenuation (100 time) , in this way the Vout is taken from a low value of resistor so there isn't any possible attenuation because, p.e., the sound card may have a low input impedance. Also with Audio precision AP1 we can have some trouble because his Zin is 100 kohm.
At the beginning it is easy to check the ratio with a low level signal, then we can increase the value to undestand if it is costant.
If we have, for example, a 1:20 ratio, with 8 volt rms on 8 ohm ( 8 watt) , delivered from ss amp on secondary ( primary) we will have ( in theory) 160 vrms (457 vpp) on secondary (primary) , good test signal.
Let me know what I wrote is clear or not
Walter
Just to make sure, I think you mentioned earlier - for the primary inductance measurement, the primary winding is left open (the resistor divider is not connected), and uses Audioreview's new software to plot the Z vs. frequency.
Yes
But if you look at the other diagram on post 1 there are tests of req. answer and THD vs freq. done with the test set mentioned
Walter
But if you look at the other diagram on post 1 there are tests of req. answer and THD vs freq. done with the test set mentioned
Walter
Let me some time to arrange a basic setup for the measurements. I'll be back... not so soon 😀 ... I have to write down some code for the measurement gears.Let me know what I wrote is clear or not
May be in a week or so. I also have to find a suitable power amplifier (wide bandwidth).
Waltube,
True, if you really want to test the transformer under full power, you should probably use a SS amp and series resistor, just as you described.
i.e., if you test the low frequency distortion without DC applied, it may or may not give the same result as it will in the actual amplifier it will be used in.
One example: 30Hz and 4000 Hz 2 tone 2nd order IM test).
i.e., if you test for high frequency rolloff, using the full swing is necessary to include the slew current which could affect that response.
For most of my low power output transformer testing, it is good enough to do as I have described, without a SS amp. I can do a reasonable comparison of various manufacturers, and of various models of the same manufacturer. And by measuring and calculating, I can get the parameters of the transformer. From that, I can calculate and predict the performance in the actual amplifier that I build.
I am in the process of characterizing an actual transformer to check Waltube's method like I promised, but progress is not really fast. I am missing some resistors of the right value, and I have blown a fuse on my 300V lab power supply. I hope I will be able to get the small parts this week.
I have already measured the magnetization properties, by applying the drive current (magetization) to the secondary, and by integrating the resulting voltage on the primary. I will post the result shortly, but in order to really tickle saturation, I had to cook my amp and the source resistor and use a frequency of 1 Hz. But the result looks to be interesting... To be continued.
I have already measured the magnetization properties, by applying the drive current (magetization) to the secondary, and by integrating the resulting voltage on the primary. I will post the result shortly, but in order to really tickle saturation, I had to cook my amp and the source resistor and use a frequency of 1 Hz. But the result looks to be interesting... To be continued.
Last edited:
to 6A3
the test set I sent is not only for full power but it allow you ti see the specs at any level yu want.
the dc aspect is not so important; on the diagram I sent we can see a reasonable low difference from with dc and without dc.
At the end of the story, if at low frequency we will have a low Z without dc we can imagine what will happen with.
to Timpert
to magnetize the secondary it is hard job and I think is not convenient for our goal.
Walter
It certainly is inconvenient... I had to really strain my amplifier, and the (heatsinked!) power resistors have left a dent in my antistatic desk mat. But if you can do it, there's a lot to learn from this curve, as it is essential transformer behavior. I will collect more measurements in the coming days, and present my findings. It's coming, but don't hold your breath...
I will also include some measurements to illustrate the importance of the signal level at which the measurement takes place, because you rightfully make a point out of driving the transformer to realistic power levels. It will be interesting, I promise...
I will also include some measurements to illustrate the importance of the signal level at which the measurement takes place, because you rightfully make a point out of driving the transformer to realistic power levels. It will be interesting, I promise...
On the test results I sent we have check the trafo with the our method for two power, 1 w and 10 w; of course we have also check other steps so we decided to use , for semplicity, this two level of power.
Good for your test.
Walter
Good for your test.
Walter
Okay, as promised... Measurements!
The guinea pig is a custom wound transformer from about 17 years back, with a rated 5k to 5 Ohms ratio, intended to be used with an SV 572-10. However, I'm going to use it as a 4k to 4 Ohm transformer, as this suits the 300B better. But that shouldn't matter for our purpose. When I refer to the primary (P), I will always talk about the HV (tube) side of the transformer. When I mention the secondary (S), it is the LV (speaker) side of the transformer.
First some essentials. With the secondary open, 1 kHz 20 Vpp applied to the primary, the voltage transformation ratio (P:S) is 32.18 : 1. The DC resistances of the windings are 141.6 Ohms (P) asnd 0.37 Ohms (S). A 4-wire capable bench multimeter was used for these measurements.
Now for the trickier bits. My LCR meter says that the primary inductance is 22 H @ 100 Hz. When measured on the secondary, it says 34 mH which would translate to 35 H on the primary. Hmmm... I need to look at the magnetization behavior. See the attached magnetization curve (horizontal unit 50 mA/div, vertical unit 2 Vs/div). I obtained it by driving the secondary at 2 Hz, from a 4 Ohms source resistance, using all the juice my amp had. I used a math channel of my oscilloscope to obtain the current through the secondary and divide it through the transformation ratio (plotted at the horizontal axis), and a second math channel to integrate the induced voltage across the primary (plotted on the vertical axis). The graph suggests a primary inductance at zero bias of around 66 H (tangent slope) and of 49.5 H at 75 mA bias. This is ignoring the coercivity of the core (the "openness" of the magnetization graph), so the actual inductance will be lower depending on the signal level. But the magnetization curve clearly shows that the transformer might do better when it is re-gapped for a large signal inductance of about 30 H. A measurement of primary inductance versus signal level is in order, which I obtained by letting my oscilloscope do the math again. Results are below.
f = 2 Hz, secondary driven to 500 mVrms, Lp = 61 H
f = 2 hZ, secondary driven to 420 mVrms, Lp = 45.2 H with the primary biased at 75 mA
Allowing for coercivity, these measurements confirm what can be seen in the magnetization curve.
f = 100 Hz, secondary driven to 200 mVrms, Lp = 37 H
f = 100 Hz, secodnary driven to 500 mVrms, Lp = 42 H
f = 100 Hz, secodnary driven to 1 Vrms, Lp = 43 H
f = 100 Hz, secodnary driven to 2 Vrms, Lp = 48 H
f = 100 Hz, secodnary driven to 4.8 Vrms, Lp = 50 H
This puts the LCR meter results in line with the oscilloscope results as well. As can be seen, at very low level (LCR meter directly on the primary), the resulting inductance is about a third of the large-signal inductance. So low-level testing is not sufficient to give an idea of the LF performance of the transformer.
The leakage inductance was measured to be 8.15 mH at 1 kHz using the LCR meter on the primary, with the secondary shorted with the shortest possible wire. This takes the primary inductance out of the equation (measuring at 100 Hz does not), while the frequency is still low enough to safely ignore the primary shunt capacitance. Leakage inductance is independent of the core, so level is not a factor here and the LCR meter does fine. The primary shunt capacitance was measured on the primary with an open secondary at 10 kHz, and found to be 1.56 nF. However, because of interleaving and this transformer being equipped with a floating Faraday shield, the shunt capacitance as measured here is best taken with a grain of salt. In general, this transformer isn't accurately described by the simplistic model from post 35, contrary to the VDV3035SE I used as an example. I no longer have that transformer.
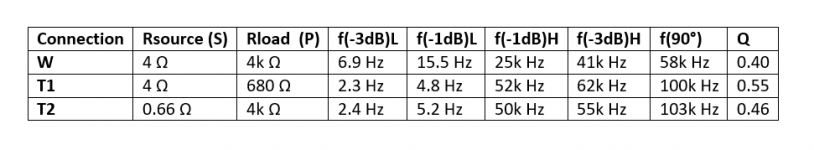
Now for the measurement this discussion is about. Walter suggests a source with the transformer's secondary rated impedance for driving it "backwards". In my case, I'd be driving it with 4 Ohms according to Walter's guidelines. The primary is then loaded with its rated impedance, in my case 4k Ohms. I'll call this connection "W".
I propose to drive the secondary with the rated load impedance as well (i.e. 4 Ohms), but instead load the primary with the driving tube's plate resistance. My 300B measures 660 Ohms Rp, so I picked a 680 Ohms resistor. I'll call this connection "T1". The resistances in this circuit are representative of a real 300B output stage (IMO), but a disadvantage is that the transformer cannot be driven to full amplitude without overloading it.
An alternative would be to transform the 680 Ohms primary source impedance to the secondary, and to transform the secondary load impedance to the primary. So the source impedance would become 0.66 Ohms, and the load impedance for the primary will be 4k Ohms. It is a bad idea to challenge the LF rolloff in this configuration, mainly because you could let the magic smoke out of the driving amp if you try. But it does allow you to measure the transformer at its nominal power in its passband. I'll call this connection "T2".
The attached table gives the results for the three configurations. I measured the LF and HF -3 dB points, the -1 dB points, the frequency at which the phase lag is 90 degrees and the attenuation at that frequency. As you can see, the W and T connections perform quite differently, just like I predicted using a simulation. The T1 and T2 connections perform quite similarly, but not the same. The -3 dB HF cutoff frequencies lie too far apart to attribute that to measurement error alone. It is a reasonable approximation though, if an error in the order of 10% is considered acceptable. For good order: all figures from this post are real measurements I did on a real transformer, no simulations!
The proof of the pudding will of course be what I'll get with a real 300B. I'd expect the HF response to look similar to the T1 and T2 connection, and the LF -3 dB point to be around 3 Hz, due to the primary inductance decreasing under bias. I have characterized a 300B on my utracer, but my HV power supply has a few more issues than just a blown fuse, so I'll have to end with a cliffhanger until I get to repair it.
The guinea pig is a custom wound transformer from about 17 years back, with a rated 5k to 5 Ohms ratio, intended to be used with an SV 572-10. However, I'm going to use it as a 4k to 4 Ohm transformer, as this suits the 300B better. But that shouldn't matter for our purpose. When I refer to the primary (P), I will always talk about the HV (tube) side of the transformer. When I mention the secondary (S), it is the LV (speaker) side of the transformer.
First some essentials. With the secondary open, 1 kHz 20 Vpp applied to the primary, the voltage transformation ratio (P:S) is 32.18 : 1. The DC resistances of the windings are 141.6 Ohms (P) asnd 0.37 Ohms (S). A 4-wire capable bench multimeter was used for these measurements.
Now for the trickier bits. My LCR meter says that the primary inductance is 22 H @ 100 Hz. When measured on the secondary, it says 34 mH which would translate to 35 H on the primary. Hmmm... I need to look at the magnetization behavior. See the attached magnetization curve (horizontal unit 50 mA/div, vertical unit 2 Vs/div). I obtained it by driving the secondary at 2 Hz, from a 4 Ohms source resistance, using all the juice my amp had. I used a math channel of my oscilloscope to obtain the current through the secondary and divide it through the transformation ratio (plotted at the horizontal axis), and a second math channel to integrate the induced voltage across the primary (plotted on the vertical axis). The graph suggests a primary inductance at zero bias of around 66 H (tangent slope) and of 49.5 H at 75 mA bias. This is ignoring the coercivity of the core (the "openness" of the magnetization graph), so the actual inductance will be lower depending on the signal level. But the magnetization curve clearly shows that the transformer might do better when it is re-gapped for a large signal inductance of about 30 H. A measurement of primary inductance versus signal level is in order, which I obtained by letting my oscilloscope do the math again. Results are below.
f = 2 Hz, secondary driven to 500 mVrms, Lp = 61 H
f = 2 hZ, secondary driven to 420 mVrms, Lp = 45.2 H with the primary biased at 75 mA
Allowing for coercivity, these measurements confirm what can be seen in the magnetization curve.
f = 100 Hz, secondary driven to 200 mVrms, Lp = 37 H
f = 100 Hz, secodnary driven to 500 mVrms, Lp = 42 H
f = 100 Hz, secodnary driven to 1 Vrms, Lp = 43 H
f = 100 Hz, secodnary driven to 2 Vrms, Lp = 48 H
f = 100 Hz, secodnary driven to 4.8 Vrms, Lp = 50 H
This puts the LCR meter results in line with the oscilloscope results as well. As can be seen, at very low level (LCR meter directly on the primary), the resulting inductance is about a third of the large-signal inductance. So low-level testing is not sufficient to give an idea of the LF performance of the transformer.
The leakage inductance was measured to be 8.15 mH at 1 kHz using the LCR meter on the primary, with the secondary shorted with the shortest possible wire. This takes the primary inductance out of the equation (measuring at 100 Hz does not), while the frequency is still low enough to safely ignore the primary shunt capacitance. Leakage inductance is independent of the core, so level is not a factor here and the LCR meter does fine. The primary shunt capacitance was measured on the primary with an open secondary at 10 kHz, and found to be 1.56 nF. However, because of interleaving and this transformer being equipped with a floating Faraday shield, the shunt capacitance as measured here is best taken with a grain of salt. In general, this transformer isn't accurately described by the simplistic model from post 35, contrary to the VDV3035SE I used as an example. I no longer have that transformer.
Now for the measurement this discussion is about. Walter suggests a source with the transformer's secondary rated impedance for driving it "backwards". In my case, I'd be driving it with 4 Ohms according to Walter's guidelines. The primary is then loaded with its rated impedance, in my case 4k Ohms. I'll call this connection "W".
I propose to drive the secondary with the rated load impedance as well (i.e. 4 Ohms), but instead load the primary with the driving tube's plate resistance. My 300B measures 660 Ohms Rp, so I picked a 680 Ohms resistor. I'll call this connection "T1". The resistances in this circuit are representative of a real 300B output stage (IMO), but a disadvantage is that the transformer cannot be driven to full amplitude without overloading it.
An alternative would be to transform the 680 Ohms primary source impedance to the secondary, and to transform the secondary load impedance to the primary. So the source impedance would become 0.66 Ohms, and the load impedance for the primary will be 4k Ohms. It is a bad idea to challenge the LF rolloff in this configuration, mainly because you could let the magic smoke out of the driving amp if you try. But it does allow you to measure the transformer at its nominal power in its passband. I'll call this connection "T2".
The attached table gives the results for the three configurations. I measured the LF and HF -3 dB points, the -1 dB points, the frequency at which the phase lag is 90 degrees and the attenuation at that frequency. As you can see, the W and T connections perform quite differently, just like I predicted using a simulation. The T1 and T2 connections perform quite similarly, but not the same. The -3 dB HF cutoff frequencies lie too far apart to attribute that to measurement error alone. It is a reasonable approximation though, if an error in the order of 10% is considered acceptable. For good order: all figures from this post are real measurements I did on a real transformer, no simulations!
The proof of the pudding will of course be what I'll get with a real 300B. I'd expect the HF response to look similar to the T1 and T2 connection, and the LF -3 dB point to be around 3 Hz, due to the primary inductance decreasing under bias. I have characterized a 300B on my utracer, but my HV power supply has a few more issues than just a blown fuse, so I'll have to end with a cliffhanger until I get to repair it.
Attachments

Last edited:
Timpert,
Congratulations! That was excellent: setup, measurements, and writeup.
And it is nice when the real measurements verifies theory.
(i.e. just one of the examples: the -1dB and -3dB low frequencies are 1 octave apart).
It would be nice to hear the completed 300B amp for those who can travel there.
Congratulations! That was excellent: setup, measurements, and writeup.
And it is nice when the real measurements verifies theory.
(i.e. just one of the examples: the -1dB and -3dB low frequencies are 1 octave apart).
It would be nice to hear the completed 300B amp for those who can travel there.
Agree, well done!
It is good to breadboard real amps in order to check what sims and/or component measurements predict.
Especially for the more difficult tubes (high Rp) breadboarding has taught me a lot.
It is good to breadboard real amps in order to check what sims and/or component measurements predict.
Especially for the more difficult tubes (high Rp) breadboarding has taught me a lot.
@timpert - thanks for sharing the results. What levels were the secondary driven with? 1W? 10W? Also did you have a chance to compare the results with the normal way, i.e., driving the primary winding?
The measurements posted were done at 500 mVrms at the secondary @ 1 kHz. The drive level was held constant over the entire frequency range. This is a rather low level, for a practical reason: if I drive the control grid of a 300B directly from my signal generator, I cannot get much more at the output. So for this reason, I did the other measurements also at 500mV, just to be able to compare apples to apples. But for the purpose (to show the difference in behavior between the W, T1 and T2 connections), the level is fine.What levels were the secondary driven with?
I could make a driver stage for the the 300B and get it up to full swing, but the whole point of this exercise is to eliminate as much disturbances as possible, and that includes any additional time constants due to power supply capacitors, cathode decoupling and driver issues. So the setup will consist of a 300B power stage fed from a stabilized power supply, with the signal generator driving the control grid directly. In this case, the frequency response is due to the properties of the 300B, the transformer and the load alone, and nothing else.
For the primary side driven measurements, I need a working HV PSU, which I don't have right now. But I am trying to get it back up and running as soon as possible.
Last edited:
Surely the signal generator can manage 500mV into 4k primary (with 4R secondary), no? If so, then no other component is involved other than the OPT and the same resistors.
The signal generator can manage that without a problem, it will do a fair bit more. Might be interesting, I will do it.
But first, I'd like to do the 300B comparison, because I want to determine which of the reverse connected measurements comes closest to the real thing. So fixing my PSU gets the priority.
But first, I'd like to do the 300B comparison, because I want to determine which of the reverse connected measurements comes closest to the real thing. So fixing my PSU gets the priority.
Yes, it will be interesting to compare the "forward" and "backward" measurements. Again, thank you for taking the time to do these measurements.
@timpert: How good is your power amplifier?
When i check(and measure) my ss amp the roll-off is about 85kHz (cheap Yamaha ss-amp)
I my case i just checked with 50Ω+Rp and with a tube (Kt88 auto bias, instead of 300B).
Kt88 80mA (signal ca.=15Vrms)

R=550Ω (small signal)

When i check(and measure) my ss amp the roll-off is about 85kHz (cheap Yamaha ss-amp)
I my case i just checked with 50Ω+Rp and with a tube (Kt88 auto bias, instead of 300B).
Kt88 80mA (signal ca.=15Vrms)
R=550Ω (small signal)
My amp is a very un-fancy Sansui AU X111 with a stated response of 10 Hz to 70 kHz and an output power of 30W at 8 Ohms. But when using the CD input, and setting the source selector to CD direct, I can achieve the desired output voltage over a much wider range. For every point I take care to set the drive level back at the target value, which more or less takes the frequency response of the amp out of the equation, provided of course that it is still able to cough up the desired voltage. It is cumbersome, but it works.
Could you plot the graphs with the same frequency range on the horizontal axis? I think I see a bit of difference in the LF response, could that be due to cathode decoupling or another additional time constant in your setup?
Could you plot the graphs with the same frequency range on the horizontal axis? I think I see a bit of difference in the LF response, could that be due to cathode decoupling or another additional time constant in your setup?
Last edited:
- Home
- Amplifiers
- Tubes / Valves
- OPT Characterization