Ssassen, I specially laid out for you several variants of the schemes so that you can choose to your taste. Start with diagram R2018-06. Take off the group delay graph
Then at least give a link to those original documents from the Hafler’s and Carver’s.
I’m in for a good laugh.
Hans
I’m in for a good laugh.
Hans
Then at least give a link to those original documents from the Hafler’s and Carver’s.
I’m in for a good laugh.
Hans
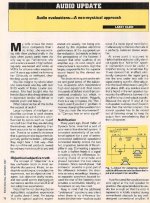
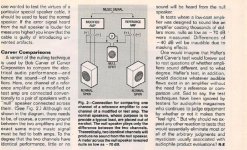
A short description of Hafler’s and Carver’s tests.
From Radio Electronics, November 1992.
Attachments
Thx Jacques,
Much appreciated.
Hans
And here is my first reaction:
When something comes out of the null speaker, what does it tell other than that both amps do not reproduce the same output for whatever reason.
But how to interpret this, that's a tough question to answer and does it really reveal what it is envisaged to reveal, namely difference in perceived sound quality ?
Last edited:
If you hear a difference in the loudspeaker, it means that the difference voltage after subtraction falls into the audio band. But besides the audible part, there may still be something above the audio range. This means that there may be an option when we see the difference with an oscilloscope, but do not hear with our ears. And then a logical question arises - does what is left out of the band have an impact on the sound? I think if it does not affect the stability parameters and does not overload the input stage with a differential signal, then it is not so important.
A short description of Hafler’s and Carver’s tests.
From Radio Electronics, November 1992.
jacques antoine, thanks! hope this helps Jan, Hans and many others ...
Jan, for a start, imagine that I am a beginner and do not know what is the meaning of the Hafler test and try to explain to me so that I understand the essence. Then explain to me what the Bob Carver Test is.
Is there anyone here who understand the microcap graphics? help explain to those who do not understand, please!
It is not a matter of understanding the graphics. That is your basic error. People do not question things because they don't understand the graphics. They would like to know what they represent and what they prove.
It is what they represent. You always fail to provide the context and so after two years you still don't get anywhere, because of your basic error and apparently your ego does not allow you to think it through.
I can throw up any graphic I want and play Banksy.
What is needed to convince people is a narrative (google that) to go with the graphic.
An imaginary example: 'This graphic shows level versus frequency of the output of amplifier xyz. Because of the R33 and C44 forming a phase lead in the forward path, the tPD will have a rising part starting at 0.234MHz. The effect on the feedback transient shows in the graph at vwy. If this is not compensated, it will be audible as blablabla."
Now we know what the graph is, what it means, and the effect of what is shown on the reproduced sound. Now we can discuss.
Jan
Last edited:
jacques antoine, thanks! hope this helps Jan, Hans and many others ...
So this is your prove, great.
You have been misled by clever marketing guys and swallow everything they throw at you.
If there ever was the smallest hope that you could shed new light on the subject of main amps, what a waste of time.
Hans
Use the ear and best known schematic, match it and end this for good.
All we need in audio is full "transparency", the fullest we could archive with technology present to this date !.
All we need in audio is full "transparency", the fullest we could archive with technology present to this date !.
After about one year I am not sure what is going on here.
The schematics presented by P2009 are nice and should work,
but, again, I fail to see what the point is. The circuitry shown
may be elaborate here and there, but in no way novel. In order
to demonstrate what he wants he should point at differences in
topology for comparison and explain his design criteria (without
inventing unknown concepts that would deserve some separate
thread).
Yes, I agree that the graphs shown are useless most of the
time, and being simulation results only (without knowing the
simulation parameters) I tend to ignore these.
A good schematic has a beauty of its own. A bad graph should
not be compared to Banksy graffity dirt.

This is a good (not very good) schematic drawing, but the bold letters make it a bad one.
Did not find Tesla here.
Did not find Tesla here.
search and study nap 250😛
EDIT: it is tesla, its about motors, and speakers are them selfs like motors in different shape.
EDIT: it is tesla, its about motors, and speakers are them selfs like motors in different shape.

Hmm, If they choose to tell you that, you than believe what you want to believe and it does not have to be the truth itself, you know.
You mean the Tesla invention ?
Sorry, but that's a pretty poor implementation, if I had students in my class that drafted that design I'd slap them around the ears 😱 ...
f I had students in my class that drafted that design I'd slap them around the ears

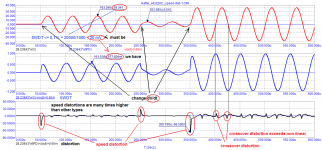
I didn't think my Banksy had to be chewed so thoroughly. Okay, back to this Hafler test. According to Hafler's calculations, this section of the SWDT sinusoid should be only 20 mV, but we have 580 mV! - 29 times more (-30 dB instead of -60 dB) - depends on tPD. Hope this is clear.
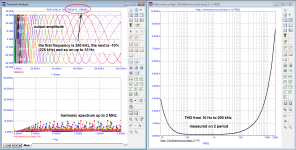
Move on. We measure all kinds of introduced distortion by subtracting the output voltage from the voltage of the ideal amplifier (which we are aiming for). For this, the voltage of the ideal amplifier is shifted by the time tPD at the test frequency. The result is shown in the lower graph. The graph shows that in the steady state we have only nonlinear and crossover distortions up to 10 mV (this is 0.025% of 40 V). At the same time, we see that speed distortions can be many times higher.
fagos asks: can crossover distortion be heard? The answer is simple: if they weren't audible, they wouldn't be driving class A amplifiers. Although not all class AB amplifiers are subject to these distortions, I have shown examples. Speed distortions occur at any deviation of the signal from the sinusoid (change in frequency, change in amplitude). But in a musical signal this is a continuous process! And if crossover distortion is heard, why shouldn't speed distortion be heard? Which are several times larger and more often than crossover. I hope these comments are enough for this test.
Attachments
Last edited:
- Home
- Amplifiers
- Solid State
- Musings on amp design... a thread split