Nice to see data of that sort.
But for each distance (which is also a time difference) shouldn't there be a correction for room reflections present at that moment in time and within the measurement window? And would that make your final curve all but flat?
Not following the measurement window aspect. This is a steady state curve. It is a typical draw away curve. That is, as you move away from the speaker the direct sound drops off and the room curve transitions to the power response of the system.
Another way to look at it is that if I bring another speaker into the room, and its directivity is similar, then equalizing it to this room curve will result in dead flat direct response.
(Just my personal soap-box, but I wish "room gain" would be used only for the mythical boost, as Linkwitz points out, in bass below lowest mode in tighly sealed concrete bunkers and well-sealed cars. Otherwise, lots of acoustic factors in rooms favouring bass but not properly called "room gain.")
Ben
fair enough
Thanks for the data, Dave. I wonder is this relates to my old pet-peeve, studio engineers trying to mix live. They are usually awful at it. They mix so bright it will tear your ears off.You can see that the movement from near to far resulted in about a 2dB shelving down of response from the low treble, with about 5dB total loss at extreme HF frequencies.
I've often wondered if that's because they are used to sitting so close to their monitors. They must have that tonal balance in stuck in mind and don't realize it does not sound right when you are 30 feet or more from the speakers. Getting a near-field tonal balance at front of house just sounds way too bright.
The top end should roll off with distance.
But what is the time line between very early disruptive and further delayed enhanced reflections specifically? Define "enhanced" for technical clarity please.
Generally I consider 10-20 ms as the dividing line between disruptive and enhancement. It is of course frequency dependent so there is no one number. If one looks at the impulse responses of gamma-tone filters (the best representation of how we hear) then 15 ms. will cover all frequencies above about 500-700 Hz (i.e. reflections will not lie within the impulse response.) Down near 100 Hz the filters are so long that basically the room has decayed before these filters do. That's why I say that as far as the ear is concerned the LFs in a small room are steady state.
"Enhanced" means that the contribution of the direct field is made greater than it is otherwise.
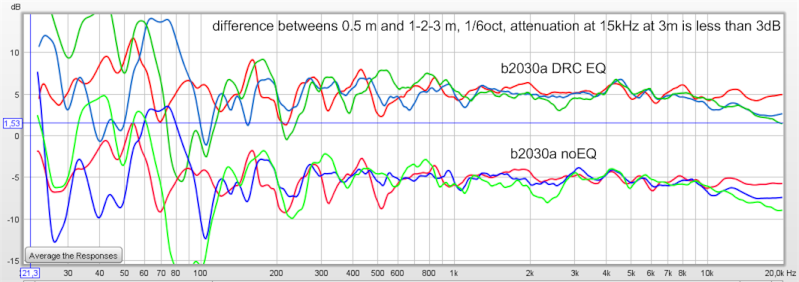
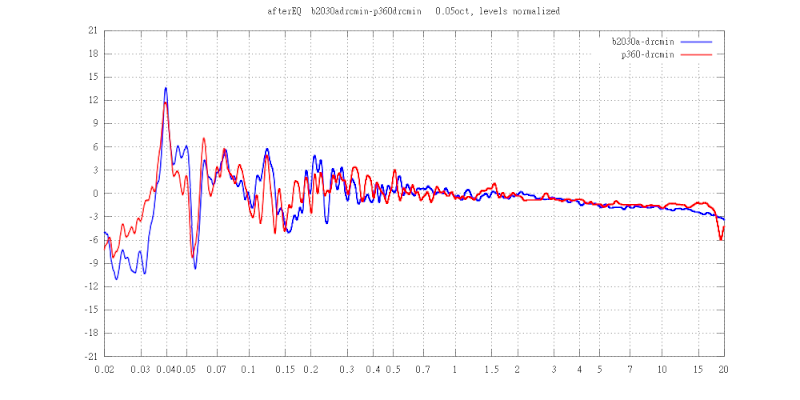
I was a bit disappointed that Dave could note give us more detailed curves so I tried to repeat his measurements with two loudspeakers in my living room. Note that the pictures only show differences between responses but with equalized levels, so it is the same as what dave presented above. Those measurements were done with log sine sweeps and no averaging.It is a typical draw away curve. That is, as you move away from the speaker the direct sound drops off and the room curve transitions to the power response of the system.
First image shows that with or without EQ, the differences are stable :
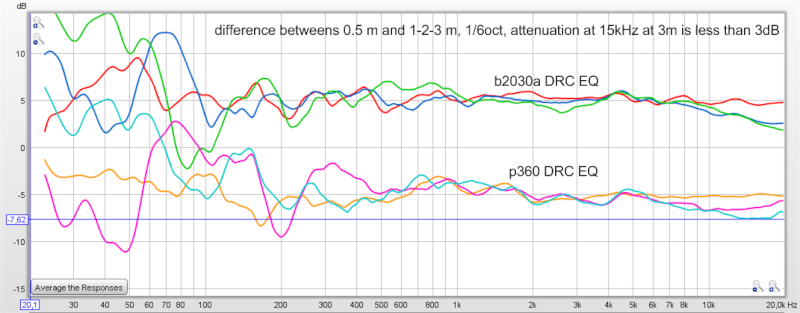
Here we compare two loudspeakers at same positions/distances :
The interesting thing is that for the second loudspeaker, we have very detailed measurements from the Harman team :
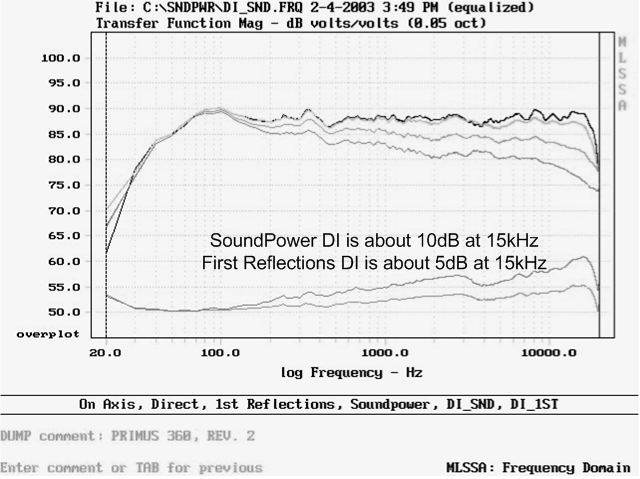
It shows that at 3m, which is beyond critical distance at all frequencies in this room, the response is near first reflections response and far from power response.
Interesting results jlo. Seems like sound power is meaningless and the steady-state response is completely swamped by direct response and first reflections response.
Is the room treated in any way? How large is it? Could you post a picture?
Is the room treated in any way? How large is it? Could you post a picture?
Yes, sure nice to see this kind of analytic measurement-making.
Not sure there's visible difference between Speaker Dave's curves and jlo's.
I seem to recall that Speaker Dave's room is very damped (right way!) and maybe jlo's is lightly damped. And that adds another data-snippet to help explore what curve means what.
For sure, the classic advice for concert halls can't be meaningful for homes (or maybe even for concert halls).
(But once again, after the dust settles on how to measure, some of us still have no solid idea of what RT60, decay, power versus direct, or other parameters lead to music happiness.)
Ben
The room is about 5.4m x 4.5m x 2.8m, untreated, wooden floor, some curtains and standard furniture.Is the room treated in any way? How large is it? Could you post a picture?
I'm working on the test I presented some posts earlier.
My first results are not fully convincing : both loudspeakers sound much similar, but can still be distinguished on pink noise
My first trials of automated spectral morphing are not precise enough : there is room for improvements 😉
Here I corrected loudspeaker B to have same curve as A.
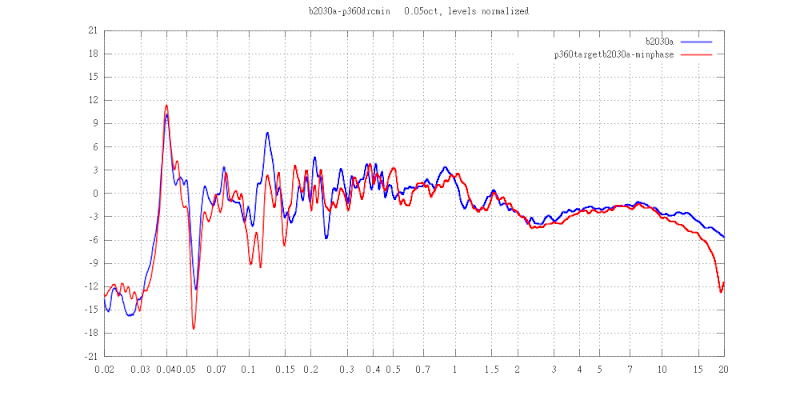
Here I corrected loudspeaker A and B to have same responses.
Last edited:
Interesting results jlo. Seems like sound power is meaningless and the steady-state response is completely swamped by direct response and first reflections response.
I don't think that you can draw that conclusion since the sound power is not shown. Those curves are for the DI, not sound power. The curves would actually be quite close to the sound power judging from the DI and axial responses.
At any rate, those are interesting graphs. Thanks jlo.
My first results are not fully convincing : both loudspeakers sound much similar, but can still be distinguished on pink noise
I believe our hearing is constantly searching for differences/patterns and there are differences between those two responses. They are small but probably not small enough to be inaudible.
Have you listened to band limited noise? Do the speakers sound more similar with higher frequency band limited noise than with lower frequency band limited noise?
That's a very good idea, thanks. When I have some time, I'll try so to know where the differences are coming from.Have you listened to band limited noise? Do the speakers sound more similar with higher frequency band limited noise than with lower frequency band limited noise?
Interesting the comment about sound power. I just got around to playing with the measurements I did a week or two back (the ones that have very unrealistic low frequency in the measurements).
I put them into PCD (after extracting minimum phase from the exported frd's)
The summed result seems to follow pretty closely the overlay of the actual mmm measurement with both woofers and MTM's playing. Only it is about 5db higher.
The interesting thing is that the predicted power response fairly closely matches the overlay curve.
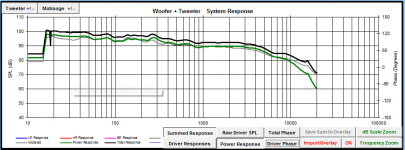
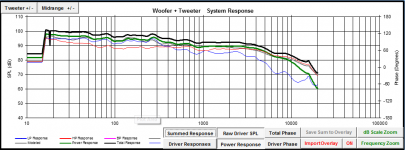
Attached are a couple of screen grabs. First has black simulated summed response, red simulated power response. Grey actual mmm measurement of both the MTM and Woofer playing simultaneously.
Second is the same, but with raw MTM (thin red) and Woofer (blue) measurements.
I Will need to try some new measurements to try and get some more realistic plots (in the bass region), but it is showing at least some promise for doing simulations of my 200 - 300 Hz crossover 🙂
Tony.
I put them into PCD (after extracting minimum phase from the exported frd's)
The summed result seems to follow pretty closely the overlay of the actual mmm measurement with both woofers and MTM's playing. Only it is about 5db higher.
The interesting thing is that the predicted power response fairly closely matches the overlay curve.
Attached are a couple of screen grabs. First has black simulated summed response, red simulated power response. Grey actual mmm measurement of both the MTM and Woofer playing simultaneously.
Second is the same, but with raw MTM (thin red) and Woofer (blue) measurements.
I Will need to try some new measurements to try and get some more realistic plots (in the bass region), but it is showing at least some promise for doing simulations of my 200 - 300 Hz crossover 🙂
Tony.
Attachments
Last edited:
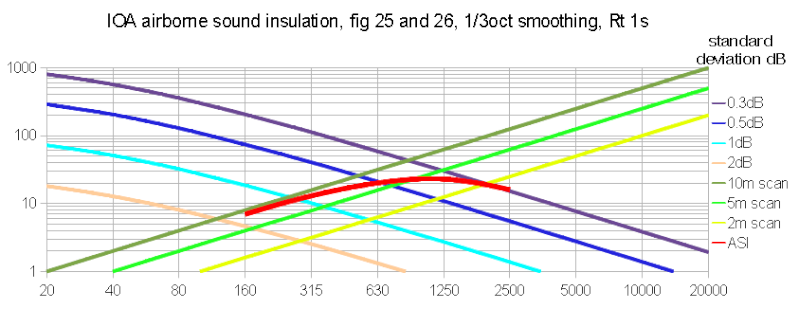
I just discoved that MMM acronym was already used for Manual Moving Microphone in a very interesting comparison of measurement methods for airborne sound insulation measurements
Another variation in test method included in the round robin study and which also raises eyebrows amongst laboratory-based acousticians is the ‘manual moving microphone’ technique. This has been labelled by some as the “Tai Chi” method, for reasons which are obvious when the technique is observed in action, and is preferred by many ANC testers and by the Robust Details inspectorate as it provides space-averaging over an infinite number of points rather than the 5 points allowed using fixed microphones.
Conclusion :
8 This investigation suggests that the manual moving mic technique (MMM), [...], produces the most repeatable results in rooms of 30m3 or more when compared with any of the other test methods. Most notable is the improved accuracy and repeatability of this method at low frequency, where modal variations produce well-documented inaccuracies in the other, more traditional test methods.
If I take fig 25 and 26 of the Airborne Sound Insulation study and plot it (as ASI curve) on my own MMM theoretical curves, it fits very well.
Last edited:
The averaging compared to single point measurements is very good, but I'm wondering if perhaps too good! The curves look way to flat to me and I'm skeptical about the result. There is no way my MTM's with two 5" woofers should be flat down to 20 Hz no matter how much room gain there is!!
Interesting! The MTM should show its natural rolloff. I have no idea why this did not happen. I do see a little room gain using RTA Vs Sweeps with my SWs, but it amounts to only a slight rise starting ~100Hz and increasing to about 2-3 dB at 20Hz. It can be seen the chart I showed comparing the averaging methods (Post 78).
I've gotten to the bottom of it. The issue was a combination of moving the mic to quickly, and microphonic (long) RCA lead from my mic preamp to the sound card.
Attached is a far more realistic curve Note that this is with 10" woofer crossed in at 270Hz not just the MTM 🙂
Tony.
Attachments
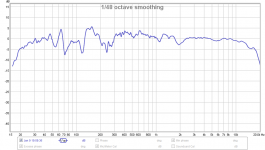
Tony, I'm curious to see the same plot with 1/6th octave smoothing. What does it look like then?
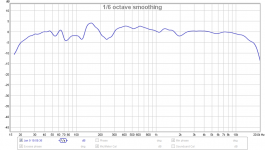
I'm not sure what causes the boost between 1K and 200Hz, it isn't there in the quasi anechoic measurements.
If the mic and speakers were in the same locations for both the MMM and the quasi anechoic measurement then I would not expect that type of difference between the 2 measurements. The consistent experience my room is that the deviation between the 2 measurements would be more irregular. The difference would become small if multiple fixed position measurements were taken from the same area that was used for the MMM measurement and averaged together. Such a smooth broad boost in that range suggests that that may not happen in your room.
If the mic or speakers locations were different then the room effects will have a completely different impact and no comparison between the 2 measurements should be made.
No the quasi anechoic were taken outside with closest boundary (other than the ground) at least 2M away. So that's why I am thinking, in room I'm probably getting re-inforcement from the wall behind the speakers (at the least) and perhaps I have overdone the bafflestep compensation (for this room) as the speakers are essentially flat when away from any boundaries.
Tony.
Tony.
That gets back to the larger question.
Assuming a speaker has a flat 1m on axis response, Is it better to only EQ below the Schroeder frequency, or is there value in EQ above that? There are strong proponents on both sides.
I have had much better results using EQ over the entire range. I found it very difficult to settle on the target curve that worked best for my situation though.
Thanks Pano. I was just thinking I should go back and do individual measurements of the woofer and MTM and re-try the sim of the crossover using the minimum phase of each and see how close (or how far off) it ends up being.
My previous attempt was flawed due to the dodgy measurements.
Tony.
My previous attempt was flawed due to the dodgy measurements.
Tony.
- Home
- Loudspeakers
- Multi-Way
- Moving Mic Measurement