HF (and unknown amounts of LF sound as well) might be getting lost due to the movement of the mic finite-sized diaphragm across the wavefronts.I have tried time synchronous averages when the timing could not be well maintained and the HF loss is considerable.
We also have to assume that the reverberant field is random (unrelated from point to point) It may be at high frequencies, but I'm not so sure about low frequencies. The SNR gain of time averaging is 3dB for every 2 to the n samples increase. How many samples can you take before the HF coherence between measurements is lost? What Direct to Reflected improvement would come from that?
Anyhow, the Direct to Reflected energy mix is not about signal vs. noise, rather early vs. late of a repeating waveform (the impulse response of a room is repeatable, late energy is not noise). This is an inappropriate application of time averaging.
Before you start squawking about how wrong I am, how about a trial measurement?
David
Given the well-presented points of view of recent posts, it may be best to just conclude that nobody can say for sure yet just what a mic being swept around by hand at uncontrolled speed and size is picking up, averaging, and/or otherwise mangling. At best, seems a good quickie method to attentuate standing waves (and some amount of non-standing-wave reflection) but maybe not reproducible enough.
Ben
Before you start squawking about how wrong I am, how about a trial measurement?
David
With such a polite invitation, I'll pass.
A chart showing the comparisons of 4 measurements methods was provided in Post 78. This may not be a universal result as my room may not be representative of all, or even most, room situations. It is data rather than prediction however. I would be interested to learn if other have found conflicting data.
Again in summary, the results were that the SPL amplitudes are very similar for 3 of the 4 methods. [All measurements were within in a 24"h x 42"w x 24"h area centered on a 13ft listening position.]
Similar SPL Averaging Methods:
1. Simple average of SPL for 12 sweeps at random stationary mic positions. (maybe 6 min.)
2. Moving mic, but using 12 sweep measurements instead of continuous RTA measurements. (2 people, maybe 2 min.)
3. MMM, REW forever averaging. (maybe 20 sec.)
[Method 3 is the most repeatable as there are many more averages involved; 219 in this case Vs 12 for the other 3 methods.]
Dissimilar SPL Averaging Method:
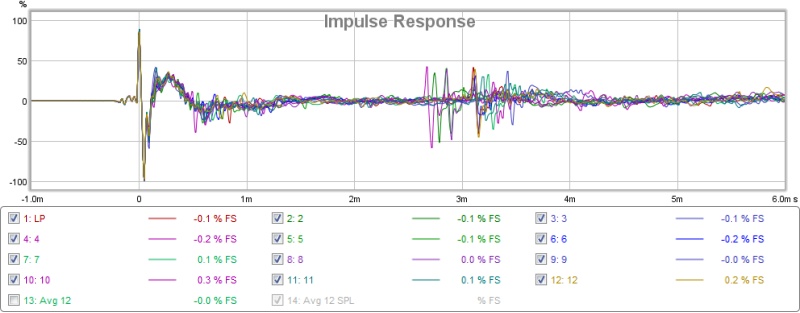
4. Complex average of 12 stationary mic locations when the IRs are manually aligned as shown below. (maybe 15min.)


As jlo mentioned in Post 239, I also find that Method 4 is helpful in some cases to pullout the direct sound phase in the MF to HF that can otherwise be hard to determine when there are numerous strong reflections. Of course windowing and smoothing can also help. I often use this method to better delineate the direct sound phase for use in rePhase.exe to establish a phase correction IR filter. See Below:


Again in summary, the results were that the SPL amplitudes are very similar for 3 of the 4 methods. [All measurements were within in a 24"h x 42"w x 24"h area centered on a 13ft listening position.]
Similar SPL Averaging Methods:
1. Simple average of SPL for 12 sweeps at random stationary mic positions. (maybe 6 min.)
2. Moving mic, but using 12 sweep measurements instead of continuous RTA measurements. (2 people, maybe 2 min.)
3. MMM, REW forever averaging. (maybe 20 sec.)
[Method 3 is the most repeatable as there are many more averages involved; 219 in this case Vs 12 for the other 3 methods.]
Dissimilar SPL Averaging Method:
4. Complex average of 12 stationary mic locations when the IRs are manually aligned as shown below. (maybe 15min.)
As jlo mentioned in Post 239, I also find that Method 4 is helpful in some cases to pullout the direct sound phase in the MF to HF that can otherwise be hard to determine when there are numerous strong reflections. Of course windowing and smoothing can also help. I often use this method to better delineate the direct sound phase for use in rePhase.exe to establish a phase correction IR filter. See Below:
Here is an example of what I told above, to smooth the spectral response, I simply smooth the IRs by removing max and min values at each time : here reflections near 3ms would be damped and would consequently not appear on the spectrum.Dissimilar SPL Averaging Method:
4. Complex average of 12 stationary mic locations when the IRs are manually aligned as shown below. (maybe 15min.)
I know it is mathematically not very elegant but why not remove extreme values to converge quicker to an average ?
Would be interesting to know from jtalden if his average in-room responses are near or not from his direct sound measurements.
I 'm not so sure : you're right saying that the impulse response at one place is repeatable. But as soon as the mic is moved to another place not too far from axis, the direct field is constant, the reverberant field keeps an average level but its frequency response is chaotic. Should we see a repeating waveform into reverberation ?speaker dave said:Anyhow, the Direct to Reflected energy mix is not about signal vs. noise, rather early vs. late of a repeating waveform (the impulse response of a room is repeatable, late energy is not noise). This is an inappropriate application of time averaging.
Last edited:
I 'm not so sure : you're right saying that the impulse response at one place is repeatable. But as soon as the mic is moved to another place not too far from axis, the direct field is constant, the reverberant field keeps an average level but its frequency response is chaotic. Should we see a repeating waveform into reverberation ?
First, the direct field from a system is only approximately constant, or slowly varying with position. If you are near any dips in the polar response, then even "slowly varying" is dubious.
The reverberant tail of a system will clearly vary considerably with position. As far as our perception goes, it actually varies little. That is if we smooth to a critical bandwidth then the decay of the tail (or the RT of a room) will not change much with position (above Schroeder frequency). But, yes, the exact tail of an impulse will change greatly with small changes in position, much like the non-smoothed room curve will. The primary point is that the reverberant tail may be highly complex but it is repeatable and not noise.
Not sure about averaging time curves or using an algorithm that shaves off high and low values. Those reflections that you see are part of the system response. Shaving them off, smoothing them out or time averaging them out will always beg the question "were they audible?" Unless we can prove they were inaudible we shouldn't be obscuring them in the measurement.
Some explanation on the time averaging/frequency averaging thing...
Most of the time we take a measurement, then transform from time to frequency, then average the responses. We achieve an average of the response spectrums, perhaps from different positions, or perhaps because our noise source needs averaging to converge on its best representation (say if we are measuring, with pink noise).
Time averaging is to average a repeated time waveform and then transform the average. So we are comparing
Measure(repeat)----transform to frequency----average
vs.
Measure(repeat)----average----transform to frequency
The first approach is usually referred to RMS averaging and the second approach is know as time averaging. Time averaging is very useful if you have poor signal to noise and a repeating waveform where you exactly know the rate of repeat. In fact you can pull a signal out of noise that totally obscures it, as long as you have some kind of trigger that gets each frame of the signal aligned with the last one. Without this trigger or exact alignment then time averaging gives undefined results. One part of the waveform in one repeat can cancel out parts of the waveform in another. You might have something as simple as a sine wave where subsequent repetitions are enough out of phase to totally cancel the wave.
If each repeat is in phase, then time averaging is great. Every time you double the number of averages the desired signal grows by a power of 2 while the random noise part only grows by the square root of 2. With the RMS average the phase is lost (from the "Squared" part) and all energy in each spectrum will always combine to the maximum, but there is no SNR improvement from multiple averages.
The notion of "aligning" multiple impulses from different measuring positions would need to rely on the direct response being invariant with angle...totally invariant. If not totally invariant then you will get an unpredictable summation of the averages and shouldn't describe the result as representative of the system. Even if the response curves at different angles look the same, if there is any phase shift (say, for either section of a 2-way), then one section or the other will have an odd and unrepresentative vector sum.
The original intent of the moving microphone approach, assuming that noise is used with a spectrum analyzer, is clearly an RMS averaging approach. If we do linear RMS (as opposed to an exponential decay type of RMS), then the result is no different than taking individual spectra at a sufficient number of the points along the sweep and then RMS averaging the individual responses (type 1 above). This approach can not narrow in on the direct sound in any way, but there is nothing wrong with this as long as an averaged response is desired, although I would still inquire as to what is psychoacoustically proper.
Regards,
David
Would be interesting to know from jtalden if his average in-room responses are near or not from his direct sound measurements.
The second chart in Post 78 shows an MMM measurement Vs a single sweep at 24":
It tracks reasonably well. The 2 sags in the sweep at the 24" mic distance that appear about 3k and 9kHz are due to the SEAS DXT TW. It employs diffraction and therefore there is noticeable variability in measurements both with slight distance changes and with slight angular changes. If several sweeps were averaged over a window scaled to the window used for the MMM measurement (maybe ±5°) these sags should be significantly reduced. If so, then the correlation between the MMM listening position measurement and averaged 24" sweeps should bee even stronger. The expected HF rolloff with distance will still be apparent of course. I may do this to see if my expectation is correct.
Thanks for your link to the measurements of post 78.
Your 4th version, the averages of the time alligned impulses, shows exactly what I had been saying. Of the 4 curves it is the odd man out with a clearly altered response in the midrange. It looks like the impulse alignment gives good response in the treble while there was enough midrange phase shift to give partial cancelation there.
I don't think more averages is the answer. The farther you move from the nominal center listening point the more your relative phase shifts will mount and the more unreliable the measurement becomes. It just doesn't work to time average incoherent impulses.
David
Yes. I think we are in agreement on that point.
Aligning IRs and "complex averaging" at the listening position does not work. That was my finding in Post 78. It is clear the phase differences from the room reflections at different mic positions create cancelation around the strong reflection points. You can easily see the radically different room influenced phase responses and the complex averaging reflects this in the SPL chart. "Simple SPL averaging", no matter the method, seem to work well at the listening position. The more averages for a given window the better the repeatability.
In my comment just above I was referring to more simple averages of SPL in a near field position (~1m mic distance). The window size being selected to complement the window size at the listening position. The reason being to find the correlation between the near field measurements and the listening position measurements. In the near field there is little influence of the room reflections until the floor/ceiling reflections start to influence the result below maybe about 1kHz in my room. Above that, windowed or not, the response is the same.
The reason for using averages at 1m instead of one listening axis measurement is just that my TW response is variable with small angular changes due to its design. The angular response at 3k and 9k is heavily influenced by the TW lens.
I did this experiment and indeed, the 9k dip was removed. The 3k dip was reduced ~50%in depth. The correlation between listening position MMM measurements and near field windowed measurements is then even stronger in my room above 1kHz. I have charts if there is interest, but it may be too much detail on one application that may not be representative of other situations.
The room reflections and modes between 200 and 1k is the problem area where I find it difficult to draw any firm conclusion as to what is best for EQ. I have settled on using the MMM for measurement convenience as it is very repeatable. I do use some modest filters in this range help with notable peaks and sags. It improves the measurements, but there is no strong impact to my judgment the sound quality. I do think it is modestly improved, but other may not agree? Pink noise sounds much more uniform between the 5 speakers using this method. Although, that may not be a strong indicator of sound quality?
Considering the large EQ variability in music source material, using the MMM method seems to work well for me as consistent measurement method on which to build a preferred house curve. I am always open to trying other methods.
I've just done a bunch of mmm measurements in my room, as the basis for trying to extract minimum phase and do some crossover modeling (around 200 - 300 hz).
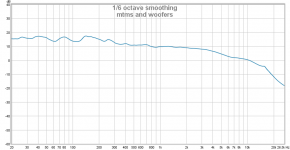
The averaging compared to single point measurements is very good, but I'm wondering if perhaps too good! The curves look way to flat to me and I'm skeptical about the result. There is no way my MTM's with two 5" woofers should be flat down to 20 Hz no matter how much room gain there is!!
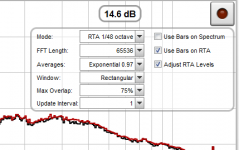
I used rew, periodic pink noise and 1/48th RTA. setting sas per the first attachment. This seemed to work well, without big changes in the averaging in a short time (like when stopping the measurement).
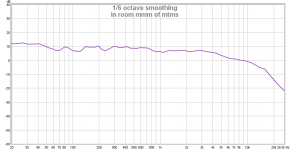
Second attachment is both MTM's running. I did a spiral meassurement round and round spiraling up to a point and then back down again. Is this too suspect to use?
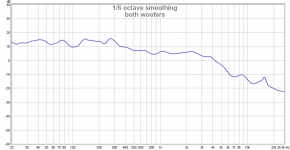
Third attachment is the measurement of both 10" woofers for comparison to the MTM's which are running full range.
4th attachment is both of the 10" woofers running by themselves, and 4th attachment is with the woofers and mtms running in parallel No crossover between them.
I'm just a bit surprised by the MTM only curve as I really do feel like they lack decent bass, but the curve would tend to indicate otherwise (unless I don't understand what the curve "should" look like
edit: btw graphs are 1/6oct smoothed.
Tony.
The averaging compared to single point measurements is very good, but I'm wondering if perhaps too good! The curves look way to flat to me and I'm skeptical about the result. There is no way my MTM's with two 5" woofers should be flat down to 20 Hz no matter how much room gain there is!!
I used rew, periodic pink noise and 1/48th RTA. setting sas per the first attachment. This seemed to work well, without big changes in the averaging in a short time (like when stopping the measurement).
Second attachment is both MTM's running. I did a spiral meassurement round and round spiraling up to a point and then back down again. Is this too suspect to use?
Third attachment is the measurement of both 10" woofers for comparison to the MTM's which are running full range.
4th attachment is both of the 10" woofers running by themselves, and 4th attachment is with the woofers and mtms running in parallel No crossover between them.
I'm just a bit surprised by the MTM only curve as I really do feel like they lack decent bass, but the curve would tend to indicate otherwise (unless I don't understand what the curve "should" look like
edit: btw graphs are 1/6oct smoothed.
Tony.
Attachments
Last edited:
I would say it is a strong indicator of the measurement/EQ quality : for timbre matching, pink noise is the most difficult signal.Pink noise sounds much more uniform between the 5 speakers using this method. Although, that may not be a strong indicator of sound quality?
If a method gives reliable results so that loudspeakers at different places in a room sound more similar, it indicates that your measuring+EQ method gets a good picture of what is audible. And this is what we are searching for.
The target house curve is the next problem.
What kind of trial measurements ? Please tell us exactly the protocol you are thinking of ?how about a trial measurement?
I have many different measurements in different rooms, I'd be happy to share the raw measurement files if it helps.
I've just done a bunch of mmm measurements in my room, as the basis for trying to extract minimum phase and do some crossover modeling (around 200 - 300 hz).
I normally just use the direct sound phase measurement to select XO filters and delay needed to achieve close phase tracking throughout the XO range. 200-300 at my listening position is busy with reflections and that would make it more difficult to do. If there is any question as to the direct phase response just move the mic nearer the speaker until the direct phase shows up more clearly. This works very well so long as the mic stays on the listening axis.
Using the minimum phase of the drivers MMM may work well also. I assume you are measuring without XO filters and will use PCD or similar to model the XO filters and delay needed. I only know how to determine the delay needed using locked time (loopback timing) with sweeps so I am not sure how this would be done using minimum phase in this manner.
The averaging compared to single point measurements is very good, but I'm wondering if perhaps too good! The curves look way to flat to me and I'm skeptical about the result. There is no way my MTM's with two 5" woofers should be flat down to 20 Hz no matter how much room gain there is!!
Interesting! The MTM should show its natural rolloff. I have no idea why this did not happen. I do see a little room gain using RTA Vs Sweeps with my SWs, but it amounts to only a slight rise starting ~100Hz and increasing to about 2-3 dB at 20Hz. It can be seen the chart I showed comparing the averaging methods (Post 78).
I would say it is a strong indicator of the measurement/EQ quality : for timbre matching, pink noise is the most difficult signal.
If a method gives reliable results so that loudspeakers at different places in a room sound more similar, it indicates that your measuring+EQ method gets a good picture of what is audible. And this is what we are searching for.
Yes, I come to feel this way also. In my room it requires some modest EQ filters in those middle freqs. If I leave these out then the sound is still very good however. Since there is expert findings that it is better to EQ to the direct sound rather than to localized room RTA in these middle freqs, it creates a dilemma for me. Maybe different room setups react better to different approaches?
I was aware the pink noise test was used in the past. Most of newer comments seem to indicate this is not the best way. I came back to this in the opposite direction. I worked through many different approaches of measuring and EQ to arrive at the MMM method and the house curve that I prefer. I only then (after the fact) compared the pink noise consistency to discover it is much more uniform this way than with my other good setups. It seems to be a good after the fact test.
Most all the commercial automated methods of EQ I am aware of use a localized averaging method at the listening area rather than one sweep so that supports this method also.
The target house curve is the next problem.
That's a major issue. I have been through 30 adjustments to arrive where I am now. It seems each recording would be a little different to fit my preference so it is a tradeoff in the end as to what is chosen. There is no value in anyone's recommendation other than giving someone a starting position.
Using the minimum phase of the drivers MMM may work well also. I assume you are measuring without XO filters and will use PCD or similar to model the XO filters and delay needed. I only know how to determine the delay needed using locked time (loopback timing) with sweeps so I am not sure how this would be done using minimum phase in this manner.
Yes the MTM does have a passive crossover but since I am only interested in the range below this (cross point it 2.8Khz) I'm just running it with the crossover. The woofers are running full range with no crossover components at all.
Jeff Bagby (or Charlie Laub) I can't remember which, has a method for working out the relative offset from minimum phase measurements. Basically using pcd you take measurements of each driver individually and then take a measurement of BOTH drivers running together. The measurement of both is used as an overlay and you sim the two individual measurements adjusting offset until your simulated curve matches the actual curve in the overlay.
I haven't done this yet (and I'm not sure it will be meaningful when I try) but I've had such trouble getting decent measurements below 200Hz I thought I would try it.
Interesting! The MTM should show its natural rolloff. I have no idea why this did not happen. I do see a little room gain using RTA Vs Sweeps with my SWs, but it amounts to only a slight rise starting ~100Hz and increasing to about 2-3 dB at 20Hz. It can be seen the chart I showed comparing the averaging methods (Post 78).
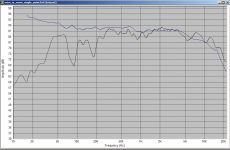
Attached is a comparison of the mmm measurement I did on the weekend (blue) with an single point measurement I did at the listening position in the same room previously. I should have done one of these when I did the mmm measurements but didn't think to do it. I think I am going to have to do some more tests and do both single point and mmm to work out whether these results are valid or completely fanciful 😉
Tony.
Attachments
Ah, the 800 lb gorilla is now coming into view: the house curve. Now it is time to start working backwards.
In your house, the house curve is the sound at your chair when you are happy with what seems like a neutral sound balance. Hint: it should be no surprise to anyone who gives it a moment of thought, but it will look a lot like a Fletcher-Munson curve or rational thought and/or my reading of forum posts over the years is faulty.
The question for this thread is which method best illuminates that curve. A problem is that direct, reflected, and resonant sound all contribute in a given room to the house curve and the different methods address each of those differently.
I don't think I am close to understanding where the learned arguments are heading at this moment. Can someone please provide a good summary to this point?
Ben
What kind of trial measurements ? Please tell us exactly the protocol you are thinking of ?
I have many different measurements in different rooms, I'd be happy to share the raw measurement files if it helps.
Earl had suggested that a span of time measurements each aligned to get the direct part to line up, averaged in time and then frequency transformed, would give a response that emphasized the direct sound and cancelled much of the reverberent sound.
It looks like jtalden has already tried this approach and his data shows the primary flaw, that phase shift between elements or in particular parts of the band would give rise to unpredictable cancellations.
David
Ah, the 800 lb gorilla is now coming into view: the house curve. Now it is time to start working backwards.
I don't think I am close to understanding where the learned arguments are heading at this moment. Can someone please provide a good summary to this point?
Ben
In the end in-room curves always require a non-flat house curve to sound balanced. The problem is that no house curve is universal.
Read the papers by Toole and Olive carefully and you will conclude that a good sounding speaker needs to have very flat and smooth anechoic response. It should have fairly smooth (peak free) and declining power response of no particular shape.
Now if we put such a speaker into a living room and take steady state measurements (such as MMM) we are typically a little beyond the critical distance. The power response will be a stronger element in the measurement than the direct response.
So what is the right house curve? The one that makes the direct/early sound flat, of course. The problem is that every speaker will need its particular house curve based on its particular power response shape.
I have long worked with DSP designers trying to come up with automatic room correction systems, and seen that they have a never ending revision to their EQ targets. No target is ever universal.
The better solution is to measure the direct sound in-room. Better yet, follow what some researchers have suggested, with a variable gating window, short at high frequencies and long at low frequencies (available with Holm impulse).
David
Right. A flat anechoic speaker (plus a necessary bit of treble boosting) will have a nice Fletcher-Munson curve in a music room due to room acoustics (sometimes called "room gain" when "room gain" per se is only a tiny or zero portion of the boost when playing music in rooms). Without the treble boosting, you get a nice mild New England sound that falls short of the Fletcher-Munson treble level.
But you missed the point about working backwards. It makes no sense to hypothesize a "correct" house curve (unless you are prescribing for all movie theatres using a proprietary system).
A Fletcher-Munson curve IS the perceived flat curve but the particular nested level is a perceptual matter that as far as I know has not been examined. I bet it a perceived loudness level, not an actual loudness*. Hence there can't be an automatic system.... and we ALL know that we fiddle with the EQ knobs after the mic has been packed away.
Now a person would want to know how that measures. And in practice, you want to know (after reading this thread) how to use a mic to achieve what you have over the years concluded is a good house curve.
Ben
*we want Carnegie Hall in our room and think the level we set is realistic. But anybody who goes to concerts knows you could (in theory) chat easily with your neighbour in Carnegie Hall but certainly not in a typical HiFi music room.
Last edited:
Reading through this very interesting discussion as quite a novice to in-room measurements, I'm wondering what's the correct way to integrate an active, multi-way speaker into a given room?
Why would I want to design a cross-over or equalize individual drivers based on MMM measurements at/around the listening spot? It seems like this will create problems every time one changes the setup in the slightest bit (e.g. speaker position and tow-in) and especially makes matching the phase very difficult.
(Maybe somewhat naively) I would have done the following instead (without an anechoic chamber available):
1) measure each driver individually from a suitable distance on axis (and possibly also at angles like the 30°/10° stated above) through gated or freefield measurements, to discard the reflected sound. The former may only be possibly at MF and HF, due to distances to surrounding walls.
2) design crossovers and EQ based on these measurements to obtain a flat FR for the single multi-way speaker at close distance, including correction of the speaker's properties (cabinet reflections, baffle step,e tc.)
3) use multiple static measurements or MMM around the listening spot(s) to additionally do an overall EQ (DRC) according to the desired house curve and achieve the integration of both (or 5 or even more) speakers in the same room with all its shortcomings (room modes, reflections, high RT60, etc.) that have nothing to do with the speaker itself.
Using MMM to achieve all of the above more quickly seems to blur/smear certain problems of different origin into one "correction", even if all this has to come together at some point anyway (e.g. in the final convolution filters or PEQ).
On the other hand I'm wondering how well the moving mic method works with speakers that rely more heavily on reflected sound or simply distribute it differently, like omni-directional concepts or certain open baffle/dipole designs? Is averaging the reflective sound and EQ afterwards really the way to go in this case?
The reality of setups is often somewhere inbetween, especially in multi-channel/home cinema setups ...
Hi Hurz, I'm only trying this because:
a) I'm naive 😀
b) I'm obsessive
c) I've not succeeded in getting any measurements that I'm completely happy with for modeling in the 200-300Hz range (see point b).
In all probability it is not going to work, but I like trying odd ball things 😉
The crossover I simmed based on single point in room measurements (smoothed to 1 octave) was ok but not great when actually realised (phase matching was not brilliant). The issue I have had with all previous measurement attempts (outside gated and in room) is that phase data below about 400 Hz is all over the shop making simulation difficult, this is just the latest hair brained scheme to try and get around that issue.
Tony.
- Home
- Loudspeakers
- Multi-Way
- Moving Mic Measurement