Congratulations on the equipment and measurement results!
Victor's oscillator is indeed of reference quality - mine is five years old, and this is what I recently measured.
The setup was Groner's notch filter (-100dB) and Groners's LNA from Linear Audio Vol. 3.
The spectrum was taken at 1Vout: nothing to measure.
Regards,
Braca
@DNi - what ADC are you using with REW to get a -190dB noise floor?
I think this is not the real THD. Physically impossible. There is a correction factor needed.
If you look at the graph, the reference seems to be about -26dBFS. The distortion scale is in dBFS. So it appears that the distortion factor, the difference between fundamental and distortion, is 26dB less than what the graph suggests.
That brings it into line with what we have seen before.
BTW A common theme in cases like this is that the top of the graph which would show the level of the fundamental, is hidden.
Jan
That brings it into line with what we have seen before.
BTW A common theme in cases like this is that the top of the graph which would show the level of the fundamental, is hidden.
Jan
Last edited:
This has to do with the calibration in REW in order to take into acount the notch filter frequency response.
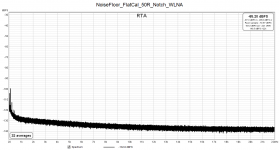
The data for the spectrum in my previous post were acquired at 48kHz and the FFT length was 524'000 (2^19). The signal level was 1Vrms.
I dont have the time at the moment to delve into the mathematics; instead, I'm enclosing two noise floor measurements of the same setup.
The first spectrum was obtained with what I call "flat calibration" - the ADC was previously loopback-calibrated, the level was checked with my HP34401A. The notch filter input was terminated with a shielded 50 ohm resistor, and its output amplified by a 60dB LNA (input-referred noise of about 1nV/rtHz).
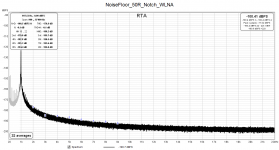
The second plot shows the noise floor when the notch filter calibration curve was taken into account. This calibration makes it possible to directly read amplitudes of the harmonics off the plot.
Returning to the first noise floor plot, imagine a 2nd harmonic at a true value of -150dbFS: it would appear in the "flat calibrated" plot at a level of -100dBFS (+60dB in LNA, -10dB in the notch filter). By "lowering" the noise floor appropriately, this harmonic appears at -150dBFS in the plot.
Last but not least, I envy your clean spectra in the LF area. My boxes are made of aluminium, so reinforcement seems to be necessary.
Regards,
Braca
The data for the spectrum in my previous post were acquired at 48kHz and the FFT length was 524'000 (2^19). The signal level was 1Vrms.
I dont have the time at the moment to delve into the mathematics; instead, I'm enclosing two noise floor measurements of the same setup.
The first spectrum was obtained with what I call "flat calibration" - the ADC was previously loopback-calibrated, the level was checked with my HP34401A. The notch filter input was terminated with a shielded 50 ohm resistor, and its output amplified by a 60dB LNA (input-referred noise of about 1nV/rtHz).
The second plot shows the noise floor when the notch filter calibration curve was taken into account. This calibration makes it possible to directly read amplitudes of the harmonics off the plot.
Returning to the first noise floor plot, imagine a 2nd harmonic at a true value of -150dbFS: it would appear in the "flat calibrated" plot at a level of -100dBFS (+60dB in LNA, -10dB in the notch filter). By "lowering" the noise floor appropriately, this harmonic appears at -150dBFS in the plot.
Last but not least, I envy your clean spectra in the LF area. My boxes are made of aluminium, so reinforcement seems to be necessary.
Regards,
Braca
Attachments
Jan, the level measured was 1Vrms, the FS of the audio interface is 5Vrms.
So in order to obtain the dBc values, any harmonics in the spectrum would have had to be corrected by 14dB.
So in order to obtain the dBc values, any harmonics in the spectrum would have had to be corrected by 14dB.
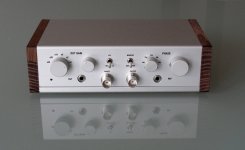
Jan, where did you source the nice metal case for your Autoranger?
Custom made by a local manufacturer. Not an option for one-off, though.
Plaatwerk | Stetec | Maarheeze
Jan
Plaatwerk | Stetec | Maarheeze
Jan
Ok. Outside of DIY.
IMO even a single piece of a similar case is within DIY. Fusion360 sheet metal design is free for DIY, the design would include all holes. Shops with metal laser-cutting machines are quite common in most areas, or online services. IME laser cutting is surprisingly inexpensive. The better ones remove the burrs, or they can be done at home easily.
Bending may be a bit more complicated as precise repeated bends require some machine setup. Nevertheless for simple bends any local metal shop will do or you can bend it at home. Powder painting is omnipresent and typically inexpensive even for single quantities. At least that is my local experience in Central Europe.
This has to do with the calibration in REW in order to take into acount the notch filter frequency response.
The data for the spectrum in my previous post were acquired at 48kHz and the FFT length was 524'000 (2^19). The signal level was 1Vrms.
I dont have the time at the moment to delve into the mathematics; instead, I'm enclosing two noise floor measurements of the same setup.
The first spectrum was obtained with what I call "flat calibration" - the ADC was previously loopback-calibrated, the level was checked with my HP34401A. The notch filter input was terminated with a shielded 50 ohm resistor, and its output amplified by a 60dB LNA (input-referred noise of about 1nV/rtHz).
The second plot shows the noise floor when the notch filter calibration curve was taken into account. This calibration makes it possible to directly read amplitudes of the harmonics off the plot.
Returning to the first noise floor plot, imagine a 2nd harmonic at a true value of -150dbFS: it would appear in the "flat calibrated" plot at a level of -100dBFS (+60dB in LNA, -10dB in the notch filter). By "lowering" the noise floor appropriately, this harmonic appears at -150dBFS in the plot.
If I understand correctly your first plot shows the "self-noise" of the notch filter amplified by the 60dB LNA. Then your second plot is an artificial noise floor that is created by applying a noise filter calibration curve on the first plot and subtracting the 60dB LNA. It this is your procedure it does not lead to correct results.
Custom made by a local manufacturer. Not an option for one-off, though.
Plaatwerk | Stetec | Maarheeze
Jan
IIRC, Schäffer in Berlin do one-offs.
< https://www.schaeffer-ag.de/ >
They seem to grow. Someone I knew used them and was happy.
Then the company was father, son and a Datron mill.
Gerhard
Hello Bohrok2610,
That is correct.
There is a calibration procedure in REW that makes this possible.
Ideally, one would have to calibrate the setup before each measurement because RC oscillators and filters drift, but the drift mostly affects the notch depth, and there I have enough reserve for a small deviation.
I've checked the harmonics' levels manually and they agree with the values obtained with the second method.
Regards,
Braca
Last edited:
That is correct.
There is a calibration procedure in REW that makes this possible.
Ideally, one would have to calibrate the setup before each measurement because RC oscillators and filters drift, but the drift mostly affects the notch depth, and there I have enough reserve for a small deviation.
Your procedure may show an artificial noisefloor of you notch filter but it is of little use. If you want to measure the noise of your notch filter you should use the noise density (V/rtHz). That is also available in REW.
Your artificial noise floor cannot be applied to THD measurements (e.g. Victor's oscillator). The noise sources in your measurement setup (LDO, notch, LNA, ADC) are not related so you cannot just subtract the notch noise from the result. Also you are ignoring the THD of your LNA and notch.
/Martti
I just use standard stuff from Fischer.
There are many commercial solutions available these days, especially on ebay.
My implementation of the Cordell Distortion Analyser
https://www.fischerelektronik.de/we...M1.05/Combination cases/PR/KO_H2_/index.xhtml
Patrick
.
There are many commercial solutions available these days, especially on ebay.
My implementation of the Cordell Distortion Analyser
https://www.fischerelektronik.de/we...M1.05/Combination cases/PR/KO_H2_/index.xhtml
Patrick
.
Attachments
Attachments

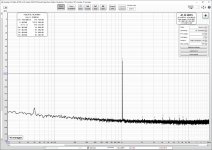
Here is a pair of plots without any gimmicks.
First is Victor 1kHz LDO with notch (about 65dB).
Second is the first one followed by a 60dB LNA.
As can be seen in the second plot the THD is much higher than just THD in first added by 60dB. This is due to LNA (and ADC) distortion. Also the noisefloor in the second plot is lower than first added by 60dB which indicates that the noisefloor in the first plot is limited by the ADC.
Attachments

If you look at the graph, the reference seems to be about -26dBFS. The distortion scale is in dBFS. So it appears that the distortion factor, the difference between fundamental and distortion, is 26dB less than what the graph suggests.
That brings it into line with what we have seen before.
BTW A common theme in cases like this is that the top of the graph which would show the level of the fundamental, is hidden.
Jan
I see far, far too many amplifier distortion and/or noise plots where dBfs, dbA, dBR, dBV are used that do not reflect reality. I was sent a plot by a guy with the peak mains component in an amp at -120 dBV and the amp spot noise floor at c. -135 dBV. Both not possible. The power transformers were 3” away from the amp boards and power amps don’t have nV wideband input noise levels. I surmise he ran the amp at full power and got a 0 dBR reading then switched the ref signal off, so the reading was dB wrt to full output.
Might be an idea to start a discussion thread on this stuff and set some ground rules. Some of it is down to misunderstanding, but some of it is . . .
I just use standard stuff from Fischer.
There are many commercial solutions available these days, especially on ebay.
My implementation of the Cordell Distortion Analyser
https://www.fischerelektronik.de/we...M1.05/Combination cases/PR/KO_H2_/index.xhtml
Patrick
.
Patrick, you are in a class all by your self. Stop giving us a bad feeling ;-)
Jan
Might be an idea to start a discussion thread on this stuff and set some ground rules. Some of it is down to misunderstanding, but some of it is . . .
Fully agree. I assume ignorance over malignancy, but sometimes you wonder.
I had a discussion with some tube guys who were using ARTA for measurements. ARTA has a legend on top of the graph indicating that the measurements are 2-channel and in V. So the legend is V/V, and the levels are shown in dBV. Those guys reported their distortion in 'dBV/V', not understanding the difference between the values and the legend. Don't ask me about the arguments ...
Jan
Last edited:
Patrick, you are in a class all by your self. Stop giving us a bad feeling ;-)
Jan
Soldering aside your Autoranger does not look too shabby. I kind of like the "military" appearance.
/Martti
- Home
- Design & Build
- Equipment & Tools
- Low-distortion Audio-range Oscillator