OK, back to the basics.0 dBFS is +20 dBu only at the minimum -12 dB gain.
You're applying 20 dB input gain in the Forte.
It be seen from the table below that the converter internal 0 dBFS is the typical 2V RMS or +8 dBu. (Clue is with the gain at -12 the Forte has a +20 dBu OL point.)
Is that value +20 more than the -12 minimum or +20 dB above unity?
From the Forte manual:

I think your results are hugely off because you're making assumptions about what 0 dBFS actually is with the gain you're applying.
Meter the A/D input with an actual AC voltmeter and use that for calibration.
I typically use 1V RMS at the A/D input and set the input gain pot so that I get -6 dBFS. That's true unity gain from the input connector to the A/D modulator and its measured below saturation and not near full scale. Then use 2V RMS as your 0 dBFS calibration value.
1 kHz 2.7 Vrms after notch (with -50 dB of attenuation) is 8,5 mVrms.
Then LNA has 28,9 dB gain what gives 237 mVrms on the input to the Forte.
When I said +20 dB gain on Forte, we have to dial knob on the Forte SW driver panel from -12 to +8 what gives 20 dB gain. This gives us FS of 0.775 Vrms on the input of the Forte (with -12 then FS is 7.75 Vrms)
20*log(237mV/775mV) gives us -10 dBFS where my Forte has the lowest distortion.
It does not matter if we have external or internal gain in front of ADC - ADC has FS of 7.75 Vrms which changes with gain applied before ADC. With 20 dB gain we get 10 times higher FS of 0.775 Vrms.
REW does not know what gain we applied before ADC.
Rms voltage was measured with Fluke 289 TrueRms multimeter.
Hope, now it should be clear enough.
Martin
Last edited:
The problem with these longer "oscillator+notch+LNA+ADC" chains is that distortion cancellation is more likely to occur. Whether or not these results are more accurate than e.g. the AP measurements seen earlier in this thread is debatable.
Yes, the results are not the same with time. It is problem to trust to such low levels of THD. I am sure that THD of less than say -130 dB is hard to proof precisely.The problem with these longer "oscillator+notch+LNA+ADC" chains is that distortion cancellation is more likely to occur. Whether or not these results are more accurate than e.g. the AP measurements seen earlier in this thread is debatable.
But we have method precise enough to measure low THD of the DUT (amps, pre-amps, DACs, etc.) with simple gear.
Martin
The problem with these longer "oscillator+notch+LNA+ADC" chains is that distortion cancellation is more likely to occur. Whether or not these results are more accurate than e.g. the AP measurements seen earlier in this thread is debatable.
True.
Since the LNA and A/D operate at reduced levels they seem to be, based on my tests, relatively spurious-free.
The notch filter, whose input operates at high levels, is another matter. It's distortion could quite likely cancel the oscillator's.
Virtually any DUT I've tested however has distortion so many times higher than the residual of the long chain the measurement errors from addition/cancellation are more likely going to be evident measuring the oscillator than the DUT.
OK, back to the basics.
1 kHz 2.7 Vrms after notch (with -50 dB of attenuation) is 8,5 mVrms.
Then LNA has 28,9 dB gain what gives 237 mVrms on the input to the Forte.
When I said +20 dB gain on Forte, we have to dial knob on the Forte SW driver panel from -12 to +8 what gives 20 dB gain. This gives us FS of 0.775 Vrms on the input of the Forte (with -12 then FS is 7.75 Vrms)
20*log(237mV/775mV) gives us -10 dBFS where my Forte has the lowest distortion.
It does not matter if we have external or internal gain in front of ADC - ADC has FS of 7.75 Vrms which changes with gain applied before ADC. With 20 dB gain we get 10 times higher FS of 0.775 Vrms.
REW does not know what gain we applied before ADC.
Rms voltage was measured with Fluke 289 TrueRms multimeter.
Hope, now it should be clear enough.
Martin
OK, so what I said originally is true.
0 dBFS in your measurement is 0 dBu with the 20 dB gain you applied.
"0 dBc" is -10 dBFS, H2 is down -158 below 0 dBc and with filter insertion loss at 2 kHz about -150 dBc. Not 160-170.
-150 dBc is 0.0000032%. H3 is relatively small but I suspect it increases under load.
Last edited:
Sorry for my question, but where your H2 of -158 comes from?True.
Since the LNA and A/D operate at reduced levels they seem to, based on my tests, be relatively spurious-free.
The notch filter, whose input operates at high levels, is another matter. It's distortion could quite likely cancel the oscillator's.
Virtually any DUT I've tested however has distortion so many times higher than the residual of the long chain the measurement errors from addition/cancellation are more likely going to be evident measuring the oscillator than the DUT.
OK, so what I said originally is true.
0 dBFS in your measurement is 0 dBu with the 20 dB gain you applied.
"0 dBc" is -10 dBFS, H2 is down -158 below 0 dBc and with filter insertion loss at 2 kHz about -150 dBc. Not 160-170.
-150 dBc is 0.0000032%. H3 is relatively small but I suspect it increases under load.
M
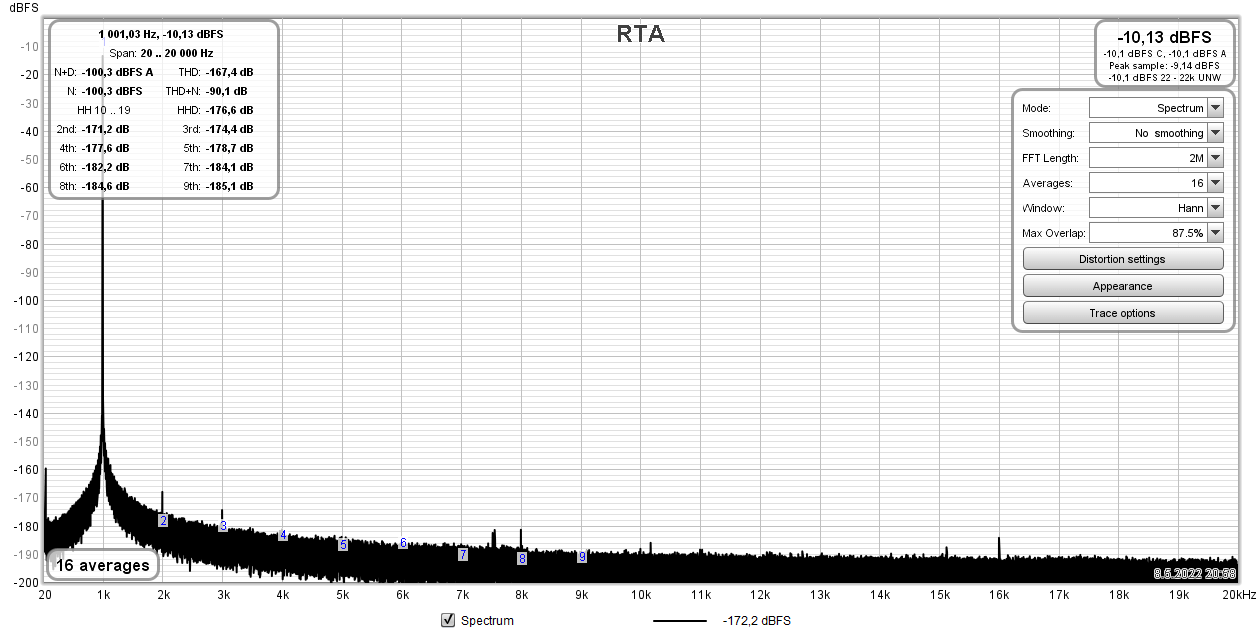
Maybe the overlay is covering it up but it looks like the 1 kHz level is about -10 dBFS.
I realize the notch level is not the carrier level but the gain you've applied to the notch is roughly equal to the notch attenuation correct? If so we can infer the carrier level from the measured notch level.
The difference between -10 and -168 is -158.
See also diyralf: https://www.diyaudio.com/community/...range-oscillator.205304/page-492#post-7017815
Last edited:
Now I see - the spikes at 2 and 3 kHz are real but REW displays wrong numbers in the distortion table.Maybe the overlay is covering it up but it looks like the 1 kHz level is about -10 dBFS.
I realize the notch level is not the carrier level but the gain you've applied to the notch is roughly equal to the notch attenuation correct? If so we can infer the carrier level from the measured notch level.
The difference between -10 and -168 is -158.
H2 seems to be -168+10 is -158 dB (from the scale) not -171.2 dB what REW sees. (OMG)
The same is for H3 -175+10 is -165 vs -174 from REW. (OMG again)
The markers of H2 and H3 from the chart are lower in the noise - they should be above the values/spikes. So it confirms the wrong level numbers.
But here you do not have to correct for notch response - it is included in the cal file applied in REW input.
So we are in the range of about -155 dB of THD (which is more real then my previous results).
It seems that REW is not always correct with low level harmonics frequency calculation from the fundamental and then with their levels. Here we are about 10 to 13 dB off.
Thanx for your help guys!
Martin
Last edited:
Now I see - the spikes at 2 and 3 kHz are real but REW displays wrong numbers in the distortion table.
H2 seems to be -168+10 is -158 dB (from the scale) not -171.2 dB what REW sees. (OMG)
The same is for H3 -175+10 is -165 vs -174 from REW. (OMG again)
The markers of H2 and H3 from the chart are lower in the noise - they should be above the values/spikes. So it confirms the wrong level numbers.
But here you do not have to correct for notch response - it is included in the cal file applied in REW input.
So we are in the range of about -155 dB of THD (which is more real then my previous results).
It seems that REW is not always correct with low level harmonics frequency calculation from the fundamental and then with their levels. Here we are about 10 to 13 dB off.
Thanx for your help guys!
Martin
You got it and you're welcome. I should have mentioned I was taking my data directly from the graph and not the table which didn't make sense to me.
I would run the FFT again with the cal file off and make sure REW is handling it correctly.
The sign of the correction file data may be wrong which could explain the errors in the table display.
I don't use REW so I'm not sure how it works.
I have a spreadsheet I use to calculate the distortion based on raw FFT readings.
It has a column for notch filter insertion loss at H2-H10 and inputs for ref level and post-filter gain.
The power sum is calculated and displayed as THD %, THD in dBc and ppm.
https://proaudiodesignforum.com/calculators/ULDO_Nacho_THD_Calculator.xls
You might try it with the RAW FFT numbers.
Do you use coherent (i.e. vector) averaging in REW for the low-THD measurements?It seems that REW is not always correct with low level harmonics frequency calculation from the fundamental and then with their levels.
I will run new FFT without cal file in REW and calculate the THD with the xls spreadsheet - it is more complicated but more precise, perhaps. Thank you for it.
I have tried coherent avg in REW but the results were THD about -175 dB so I ignored it as unrealistic. I can show the REW FFT later, if you want.
But for me the ability to measure THD of DUT with levels less than -130 dB is good enough. I do not need more - everything started a year ago with my composite amp for tweeter section of my Linkwitz Orion speakers, I was not able to measure its low THD with my card, so I started to look for a low THD measurement threads on this forum and it gave me lot of experiences and fun as you see🙂
Last edited:
Hidden gotcha with the FFT's of an analog oscillator like the Victor's. The oscillator drift during the measurement could be enough to blur between "bins". I have been burned by this. However the -150 dB+ numbers are what I have seen with victor's oscillators. his current offering are better than my first gen which was in the -155 dB range. Cancellation is a real possibility but you can quickly see if its cancelling by paralleling a cap on the output to attenuate and phase shift the harmonics which will change the cancellation. If its not cancelling then the level should shift as predicted.
At and below -150 dB passive components start limiting your efforts Pots and some caps are the worst offenders but even some metal film resistors can show issues relating to internal construction as you get to -160 dB+
At and below -150 dB passive components start limiting your efforts Pots and some caps are the worst offenders but even some metal film resistors can show issues relating to internal construction as you get to -160 dB+
Yes, oscillator dift could be the problem. I could try to lock the frequency in the future, if I will need so.Hidden gotcha with the FFT's of an analog oscillator like the Victor's. The oscillator drift during the measurement could be enough to blur between "bins". I have been burned by this. However the -150 dB+ numbers are what I have seen with victor's oscillators. his current offering are better than my first gen which was in the -155 dB range. Cancellation is a real possibility but you can quickly see if its cancelling by paralleling a cap on the output to attenuate and phase shift the harmonics which will change the cancellation. If its not cancelling then the level should shift as predicted.
At and below -150 dB passive components start limiting your efforts Pots and some caps are the worst offenders but even some metal film resistors can show issues relating to internal construction as you get to -160 dB+
For now, I am satisfied with my results.
Martin
You got it and you're welcome. I should have mentioned I was taking my data directly from the graph and not the table which didn't make sense to me.
I would run the FFT again with the cal file off and make sure REW is handling it correctly.
The sign of the correction file data may be wrong which could explain the errors in the table display.
I don't use REW so I'm not sure how it works.
I have a spreadsheet I use to calculate the distortion based on raw FFT readings.
It has a column for notch filter insertion loss at H2-H10 and inputs for ref level and post-filter gain.
The power sum is calculated and displayed as THD %, THD in dBc and ppm.
https://proaudiodesignforum.com/calculators/ULDO_Nacho_THD_Calculator.xls
You might try it with the RAW FFT numbers.
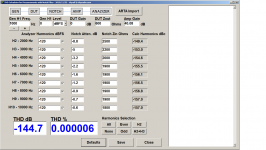
Here I can recommend my THD calculator.
Attachments

oh nooo, AP's trustable result -140-145db(usually 2nd is worse due to MOSFETs in the MDACs) at 1kHz and depends on the level. A passive TT-notch with decent parts(fresh calibrated at the particular out/in impedance) is 15db better at least. Furthermore, OSC->notch and its buffer will have naturally formed 3rd harmonics about 0dg i.e. clipping-like, hence no self-compensation is possible there. Another thing is ADC which may have LUT to compensate 3rd harmonic with 180dg anti-harmonic.The problem with these longer "oscillator+notch+LNA+ADC" chains is that distortion cancellation is more likely to occur. Whether or not these results are more accurate than e.g. the AP measurements seen earlier in this thread is debatable.
Thank you for the THD calculator. Very nice.Here I can recommend my THD calculator.
To me accurate means also consistent. With LDO, notch, LNA, ADC THD compensation etc. the result may vary depending on level and possible distortion cancellation and you are stuck with one frequency. How about IMD measurement?oh nooo, AP's trustable result -140-145db(usually 2nd is worse due to MOSFETs in the MDACs) at 1kHz and depends on the level. A passive TT-notch with decent parts(fresh calibrated at the particular out/in impedance) is 15db better at least. Furthermore, OSC->notch and its buffer will have naturally formed 3rd harmonics about 0dg i.e. clipping-like, hence no self-compensation is possible there. Another thing is ADC which may have LUT to compensate 3rd harmonic with 180dg anti-harmonic.
all DACs I know at least 2ch, right? Just add there 1k LPF to the left, and 10k LPF to the right, to get 2 frequencies.
Or use some DIP-switches to vary 60Hz, 7kHz, 1kHz, 10kHz..
Or use some DIP-switches to vary 60Hz, 7kHz, 1kHz, 10kHz..
for IM measurements the harmonics of the oscillators is far less important. The harmonic relationship is important- as in there should be none. The analysis side is more challenging but imminently possible. I have a homebrew analyzer (not my work) that has a -120 dB residual. I can share the documentation if anyone is interested.
Why go through all the loops and hoops with notches, LNAs or THD compensations when decent result is possible with just DAC and ADC (here AK4490 L+R at -8dBFS & ES9822PRO).


Why go through all the loops and hoops with notches, LNAs or THD compensations when decent result is possible with just DAC and ADC (here AK4490 L+R at -8dBFS & ES9822PRO).
Some folks want better than "decent". I completely agree that decent is almost certainly more than adequate for measuring audio system products intended for actual listening. But, everybody has their own set of interests.
I'd argue that there's lots of other system parameters that are very often ignored in favor of the last couple dB of precision in harmonic distortion. Immunity from common mode currents being but one example.
- Home
- Design & Build
- Equipment & Tools
- Low-distortion Audio-range Oscillator