Yes, virtual GND of the board.
The RCA connector is still connected to GND right?
Regards,
TJ.
Here are the results of several tests I made with pilot tone injection at the notch filter input, as Bob Cordell suggested.
The first step was to recalibrate the setup with REW RC8.
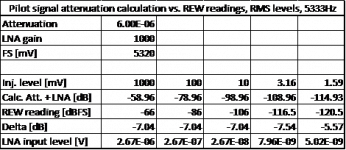
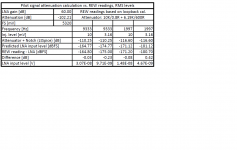
Injection of the pilot tone was effected through an electronically compensated, transformer-isolated interface I got from a colleague. Since I wanted to test the entire setup as a whole, attenuation of the pilot signal must also account for the 60 dB LNA, so I connected a 100M resistor between my soundcard DAC output and the notch filter input. With the Victor's output impedance of 600 ohms, this gives an attenuation of 6E-6, i.e. -104dB. However, the first measurement with an 1Vrms pilot tone appeared at -66dBFS in the spectrum instead of -59dB that the calculation predicted.
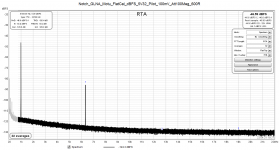
I then simulated the attenuator together with the notch filter using LtSpice and the measurement was confirmed with a deviation of 1dB (sim. was at -58dBFS). Since this offset theoretically does not depend on the signal level, I thought that it could be used as an indicator of the setup linearity as the pilot tone level approaches the noise floor. I then made a series of five measurements at the respective injection levels of 1000, 100, 10, 3.16 and 1.59mVrms. The first three points were 20dB apart, then 10dB and finally 6dB. The last level corresponds to a voltage of about 5nV at the LNA input. The output level of the Victor's oscillator was 1Vrms in all measurements.
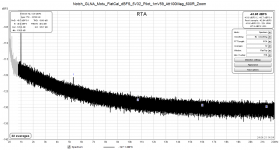
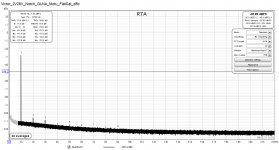
The first spectrum attached shows the results of the highest level pilot tone measurement (1V), and the second one was obtained at the lowest level of 1.59mV (zoomed for clarity). The results of all five measurements are summarized in the Table below and show the same difference between the calculation and the measurement (the row "Delta") at the first three levels, the next one is -0.5dB off and the last one +1.5dB off.
I interpret these results as an indicator of a very good linearity of the setup given that the last two LNA input levels are in the single-digit nanovolt range at the pilot frequency used.
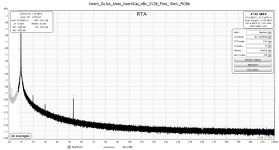
The last spectrum shows a measurement of the oscillator signal at the maximum level of 2.28Vrms. The calibration file used accounts for the notch filter attenuation, and the results are in terms of dBc referred to the above level. The 2nd harmonic is at -97dBc; shifting this figure downwards by the LNA gain gives -157dBc, not far away from the result I quoted previously:
Low-distortion Audio-range Oscillator
Note that REW favoured the pilot tone as the reference for the THD calculations in all measurements I made, so all my numbers are visual readings off the respective plots. Note also that the fundamental peak level in RTA after the notch filter calibration is not correct any more (it was about -31dBFS in a flat calibration). I followed the procedure for obtaining a notch calibration file outlined by JohnPM but there may be an error somewhere that I'm not aware of.
Based on the results presented it appears that the lowest resolvable level of my setup is about -180dBFS at the pilot frequency of 5333Hz, and about -170dBFS at 2kHz. In terms of the signal amplitude it amounts to 8 and 24nV, respectively.
Regards,
Braca
The first step was to recalibrate the setup with REW RC8.
Injection of the pilot tone was effected through an electronically compensated, transformer-isolated interface I got from a colleague. Since I wanted to test the entire setup as a whole, attenuation of the pilot signal must also account for the 60 dB LNA, so I connected a 100M resistor between my soundcard DAC output and the notch filter input. With the Victor's output impedance of 600 ohms, this gives an attenuation of 6E-6, i.e. -104dB. However, the first measurement with an 1Vrms pilot tone appeared at -66dBFS in the spectrum instead of -59dB that the calculation predicted.
I then simulated the attenuator together with the notch filter using LtSpice and the measurement was confirmed with a deviation of 1dB (sim. was at -58dBFS). Since this offset theoretically does not depend on the signal level, I thought that it could be used as an indicator of the setup linearity as the pilot tone level approaches the noise floor. I then made a series of five measurements at the respective injection levels of 1000, 100, 10, 3.16 and 1.59mVrms. The first three points were 20dB apart, then 10dB and finally 6dB. The last level corresponds to a voltage of about 5nV at the LNA input. The output level of the Victor's oscillator was 1Vrms in all measurements.
The first spectrum attached shows the results of the highest level pilot tone measurement (1V), and the second one was obtained at the lowest level of 1.59mV (zoomed for clarity). The results of all five measurements are summarized in the Table below and show the same difference between the calculation and the measurement (the row "Delta") at the first three levels, the next one is -0.5dB off and the last one +1.5dB off.
I interpret these results as an indicator of a very good linearity of the setup given that the last two LNA input levels are in the single-digit nanovolt range at the pilot frequency used.
The last spectrum shows a measurement of the oscillator signal at the maximum level of 2.28Vrms. The calibration file used accounts for the notch filter attenuation, and the results are in terms of dBc referred to the above level. The 2nd harmonic is at -97dBc; shifting this figure downwards by the LNA gain gives -157dBc, not far away from the result I quoted previously:
Low-distortion Audio-range Oscillator
Note that REW favoured the pilot tone as the reference for the THD calculations in all measurements I made, so all my numbers are visual readings off the respective plots. Note also that the fundamental peak level in RTA after the notch filter calibration is not correct any more (it was about -31dBFS in a flat calibration). I followed the procedure for obtaining a notch calibration file outlined by JohnPM but there may be an error somewhere that I'm not aware of.
Based on the results presented it appears that the lowest resolvable level of my setup is about -180dBFS at the pilot frequency of 5333Hz, and about -170dBFS at 2kHz. In terms of the signal amplitude it amounts to 8 and 24nV, respectively.
Regards,
Braca
Attachments
You can tell REW the fundamental frequency to use by playing the generator at that frequency (it doesn't have to be connected to anything). The correct level for the fundamental can be entered using the Manual fundamental entry in the Distortion settings.
Thank you John.
I know that I can lock the FFT to a generator frequency but since I'm already using one channel to generate the pilot signal, I would need another generator instance for the FFT.
I might be missing something, but I don't see a possibility for launching two independent generators in REW.
Re. the calibration curves, the fundamental level in the fourth attachment is not correct because I shifted the notch calibration curve such that the pilot tone level is the same in the "Soundcard" and the "Notch/Soundcard" setups. Shifting the latter by the LNA gain gives a correct fundamental and harmonics' levels and the "noise floor" around -180dBFS.
So it is a matter of choice; and for everyday's work I prefer the second variant.
Regards,
Braca
Perhaps as a bodge use something like the 10th harmonic of the fundamental as the pilot via the 'add harmonic distortion'.
I think 100M will be troublesome. The capacitive reactance of 1 of at 2 KHz is around 70MOhms. And the capacitances between the leads could be around .5 pF.
It's usually better practice to use lower impedance for dividers for AC. I would have used 10K and 1 Ohm for 80 dB and then use 60K to couple to the 600 Ohms for another 20 dB. High frequency attenuators are difficult.
A -100 dB marker should give a good reference that can be checked without the notch and then with the notch.
Ultra low distortion measurements are also really hard to make accurately.
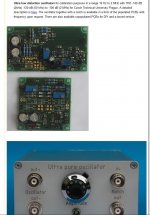
For PCBs for oscillators and notch filters?
Here are is one option: Development
Just email them: JanasCard
Here are is one option: Development
Just email them: JanasCard
Attachments
Come across this board: PSIEVM Evaluation board | TI.com
Price is not friendly, but idea is right.
DDS synthesizer followed by high-Q selective filter. Not sure, if the sequence of the MFB stages is correct, probably stages with gain better to put earlier in chain, than low gain filter 'd have lower overall THD, attenuating all distortions - dds & distortions introduced by first stages
Quite interesting. Here is the detailed info: https://www.ti.com/lit/ug/sbau289/s..._url=https%3A%2F%2Fwww.ti.com%2Ftool%2FPSIEVM The performance is good, not exceptional but it is locked to a clock. The same concept of active bandpass filters on the output of a high performance DAC chip could work really well. Maybe a system controlled tuned filter? The MFB filters address the common mode problem of the VCVS.
Am I reading that right, 245 megabytes for the "GUI installer?" I know, it basically includes a
(ahem) cut down version of LabView, but it still seems like a lot to me.
I got a TI temperature sensor eval kit that had a similar LabView download (I don't remember, but I think it was "only" 20 megabytes), it worked fine but I did as much with an Arduino and i2c driver code straight to the sensor, and running the output into Excel.
Thank you for your comment. I only now got around to performing a systematic check of my setup along the lines suggested.I think 100M will be troublesome. The capacitive reactance of 1 of at 2 KHz is around 70MOhms. And the capacitances between the leads could be around .5 pF.
It's usually better practice to use lower impedance for dividers for AC. I would have used 10K and 1 Ohm for 80 dB and then use 60K to couple to the 600 Ohms for another 20 dB. High frequency attenuators are difficult.
A -100 dB marker should give a good reference that can be checked without the notch and then with the notch.
Ultra low distortion measurements are also really hard to make accurately.
The attenuator I used for the measurements presented below was built with 0.1% resistors (Holco), first section as 10K/0.8R, followed by 6.19K/600R for another -20dB, the total attenuation being -102.2dB. However, the notch filter provides additional attenuation, so I used LtSpice to calculate the total attenuation between the injection interface and the LNA input.
All tests were performed in the calibration manner, i.e. without the Victor's oscillator.
The first test was to check whether the setup remains linear w.r.t. signal level as the latter is reduced - initially in steps of 20dB, and then 10dB in the vicinity of the noise floor. This was found ok (within 0.5dB) both with and without the notch filter at the LNA input, and at all injection levels from 1V down to 3.16mV.
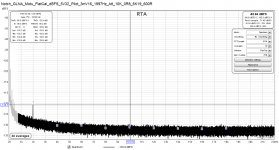
In order not to overload the post, I'll present only the results for the last two levels I used (10 and 3.16mVrms, i.e. 10dB apart, at the attenuator input) at each of the two frequencies of 1997 and 9333Hz. The calibration file employed was pure audio interface loopback, referred to in the plots as "FlatCal".
The first two plots represent the results at a freq. of 9333Hz, and the other two at a freq. of 1997Hz, i.e. approx. at the 2nd harmonic of the Victor's oscillator. The 10dB difference between the respective level is preserved at both frequencies, as the numerical results of the Table attached indicate.
As per LtSpice, the respective attenuation at the two frequencies is -110.2 and -116.6dB. Based on these values, the expected levels at the LNA input are listed in the next row in terms of the audio card dBFS (5.32Vrms) for comparison with the measured values (next row). The respective differences between the predicted and the measured values are very small, and based on these numbers, my setup appears to be able to resolve 5nV at the LNA input.
The same behaviour was observed when using a notch filter calibration file obtained as described by JohnPM.
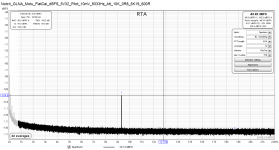
Looking now at the spectrum of the oscillator at the maximum level of 2.28Vrms (last att.), the 2nd harmonic is listed as -107.4, and the 3rd as -111.2dBc in the RTA THD box. Accounting for the notch filter attenuation and the LNA gain (60dB), their true levels are -157.4 and -165.2dBc, resp.
The above values don't differ much from the ones I presented before, but note that some of the latter ones were visually estimated from the respective plots.
I think that these results represent a solid basis for further experiments with this setup.
Regards,
Braca
Attachments
-
 Victor_2V28V_Notch_GLNA_Motu_FlatCal_dBc.png56.7 KB · Views: 148
 -
 Pilot Tone Analysis LowImpAttenuator.png46.2 KB · Views: 474
 -
 Notch_GLNA_Motu_FlatCal_dBFS_5V32_Pilot_3mV16_1997Hz_Att_10K_0R8_6K19_600R.png58.8 KB · Views: 467
 -
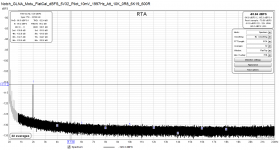 Notch_GLNA_Motu_FlatCal_dBFS_5V32_Pilot_10mV_1997Hz_Att_10K_0R8_6K19_600R.png59.6 KB · Views: 504
 -
 Notch_GLNA_Motu_FlatCal_dBFS_5V32_Pilot_3mV16_9333Hz_Att_10K_0R8_6K19_600R.png54.4 KB · Views: 466
 -
 Notch_GLNA_Motu_FlatCal_dBFS_5V32_Pilot_10mV_9333Hz_Att_10K_0R8_6K19_600R.png53.8 KB · Views: 477
Very interesting design. I didn't know crystals were available at such low frequencies.
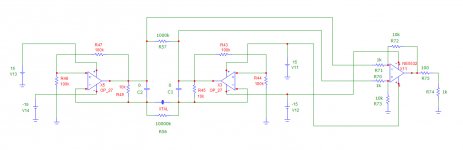
If I interpret correctly, the crystal network is parallel resonant. I wonder if Vicktor's design
could be adapted with the xtal in the feedback of the right-hand opamp? The Q is so high that ALC compensation might be a challenge.
Looks like fun. Enjoy!
If I interpret correctly, the crystal network is parallel resonant. I wonder if Vicktor's design
could be adapted with the xtal in the feedback of the right-hand opamp? The Q is so high that ALC compensation might be a challenge.
Looks like fun. Enjoy!
- Home
- Design & Build
- Equipment & Tools
- Low-distortion Audio-range Oscillator