Does that explain the rise of the THD plots at that frequency region?The electric field of the coils, i.e. the coils themselves and the capacitive parasitic component ..!
Methinks, the actual reason for those anomalies (the worthened crosstalk and increased THD) is the cantilever's own resonance, when it flexes at ~15~25kHz. It is not rigid enough.
Sometimes one read this in blog entries.(...) is the cantilever's own resonance, when it flexes at ~15~25kHz. It is not rigid enough.
But with regard to the THD increase associated with high frequencies (super high frequency range), it is obvious that mechanical problems have the upper hand in the game. The stiffer the stylus ("Taststift"), the better.
I get very similar rise of THD and almost non-existing channel separation near the tonearm effective mass+cantilever elastomer resonance. That's why I tend to believe in the ressonance explanation rather than in the electromagnetic coupling one.
Let me see if I understand you correctly:(...) almost non-existing channel separation near the tonearm effective mass+cantilever elastomer resonance.
We know the mass of the tonearm, and balance it, i.e. the beam /bar balance is horizontal. We take the so-called compliance, i.e. the reciprocal value of the spring stiffness, from the system manufacturer's data ...
Now there are two main mechanical resonances, the bass resonance and the treble resonance. We determine the first and skillfully place it in the range below 12Hz by selecting our arm and pickup.
The low frequency sound on a long-playing record is always monaural, i.e. the amplitude and phase of the signal is identical on both channels. In this lower band, we are not even talking about channel separation or crosstalk.
The second mechanical resonance occurs primarily in the needle carrier, but the moving masses of the transducer parts are also part of it. Just like the subbass resonance, the second resonance is not part of the audio spectrum, i.e. it must always lie clearly outside it. Greater than 20kHz, of course. We can calculate or estimate it.
The prize question is, are they series or parallel resonances in the electrical equivalent? Why don't we ask the manufacturer or the sales department for the exact correlations and data?
The Shure V15 III mentioned in this thread (and in the parallel thread) is now 50 years old.
greetings,
HBt.
I check the channel separation with a test record, where a gliding tone is swept in only one channel at a time.
There is no what they call elliptical filter involved in this (test signal) recording. If it was - then the separation would appear only above ~150Hz.
Because on a TT I play with the main resonance is at 13Hz and it is not damped at all, it affects the tonearm behaviour at as hight frequencies as 30~40Hz.
So, I see huge bulge near 20Hz - in both channels simultaneously, at ~30~50Hz the crosstalk gets better. Along with this crosstalk curve - the THD curve also goes down.
On a properly damped tonearm there is no such ILF bulge of the frequency response and no huge crosstalk and THD either.
If I had QR2010 I could provide some measurements data - how bad is my first tonearm and how good is the second. According to the specs - the second one has its' ILF resonance so well damped that the ILF hump is only about 2dB (at 8Hz). I suspect my bad tonearm has a ~20dB peak at 13Hz.
This makes me believe, as I said earlier, in the resonance nature of the HF crosstalk/THD plots. And because it is not the needle+vinyl resonance, it must be the cantilever flexing one.
Ok, I have understood your point. Let's just leave it as a hypothesis - in combination with the THD.
#
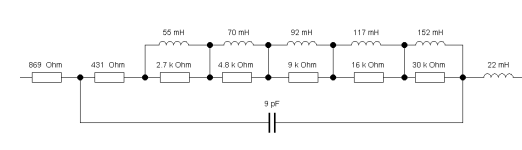
But back to modeling the driving transducer coil. Marcel vdG. has provided us with six support points. Let's use them too. Shure recommends up to 400pF || 47k up to 70kOhm, with no audible changes. We need an electrical replacement model with a very wide range of validity. It should be 100Hz to 200kHz.
#
But back to modeling the driving transducer coil. Marcel vdG. has provided us with six support points. Let's use them too. Shure recommends up to 400pF || 47k up to 70kOhm, with no audible changes. We need an electrical replacement model with a very wide range of validity. It should be 100Hz to 200kHz.
Attachments
Last edited:
It seems you finally gave up your prejudice against accuracy, glad to see 😂What frequency resolution do you want - and in which decades?
However in this case it will not change the conclusion that this Cartridge is not suited for 150K or damped termination.
Hans

Dear Hans P. ,It seems you finally gave up your prejudice against accuracy, glad to see 😂
are you deliberately misunderstanding me, for whatever psychological reason? I am a proponent of accurate measurement technology.
Nonsense!However in this case it will not change the conclusion that this Cartridge is not suited for 150K or damped termination.
Hans
Just try a termination with 150kOhm, in reality of course. Incidentally, I maintain that your MM paper has no scientific claim whatsoever, it is close to zero.
#
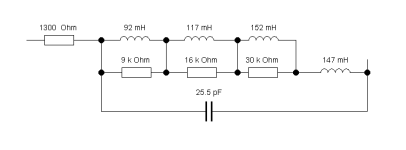
Attached is another network option.
HBt.
Attachments
This certainly is a point that deserves some attention.This makes me believe, as I said earlier, in the resonance nature of the HF crosstalk/THD plots. And because it is not the needle+vinyl resonance, it must be the cantilever flexing one.
When flexing of the cantilever would be the cause of diminishing channel separation, I would expect this to be visible as a drop in the carts frequency response.
1) The measured FR of my Benz cart is that it has a flat response within +/- 1dB up to somewhere between 40kHz and 50kHz.
2) However the channel separtion is the same bathtub curve as most carts, rising sharply as from 5kHz upwards,
To me 1) and 2) do seem contradictory in case of seeing flexing of the cantilever as the cause of diminishing channel separation.
Hans
So let's start with Adam and Eve
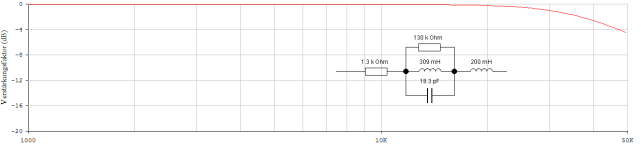
We see a clear parallel resonance in the measurement record of the HP analyser. There must therefore be a parallel resonant circuit as a simple two-pole. Its impedance maximum appears to be closer to the 100kHz limit (our decade) than to 10kHz, i.e. I need more data than is available for perfect modelling of the DUT. I need data from the following decade and this ends at 1MHz.
However, without more detailed knowledge of the complex input impedance of the analyser (as well as the real measurement setup and the conversion method), the data is largely unusable.
We have to ask ourselves questions about the necessary corrections to the measured values and answer them (plausibly and) correctly. If the existing record is already free of any unwanted influence on the measurement procedure and its input amplifier, then we will also have to identify a series resonance in the following decade.
tbc
That's absolutely correct Hans.(...) contradictory in case of seeing flexing of the cantilever as the cause of diminishing channel separation.
👍
KT315A's
question is:
in conjunction with the THD.
...
So if there really is a parallel resonant circuit, then there must be a capacitive reactance (an energy store) hidden in the pickup.
L parallel C.
However, both components are lossy and frequency-dependent. And that would be the first starting point for modelling, our starting point.
@Hans Polak
Can you give us honest information about your measurements? The measuring device, method, test circuit setup ... and the data as |Z|*e^j(angle) from 500Hz to 1MHz ?
kindly,
HBt.
PS
I assume that you will not answer helpfully. I even question your entire work, to be precise, its value. Until you answer sensibly and go into the missing details.
The six points were completely sufficient for Marcel's article topic, the noise:
6kOhm *e^j72°
14kOhm *e^j72°
20kOhm *e^j70°
28kOhm *e^j66°
37kOhm *e^j61°
50kOhm *e^j53°
at 2kHz, 5kHz, 7kHz, 10kHz, 14kHz, 20kHz.
But for an almost complete MM cartridge modelling (electric) they are not.
6kOhm *e^j72°
14kOhm *e^j72°
20kOhm *e^j70°
28kOhm *e^j66°
37kOhm *e^j61°
50kOhm *e^j53°
at 2kHz, 5kHz, 7kHz, 10kHz, 14kHz, 20kHz.
But for an almost complete MM cartridge modelling (electric) they are not.
We therefore need the magnitude and the angle of the vector (pointer).
What is the respective resolution of the analyser used in the frequency- /or measuring ranges?
0.1° for the angle?!
Are you now going to come up with all the missing answers Hans? Unfortunately, the modelling process is only one of the points.
😢☕
What is the respective resolution of the analyser used in the frequency- /or measuring ranges?
0.1° for the angle?!
Are you now going to come up with all the missing answers Hans? Unfortunately, the modelling process is only one of the points.
😢☕
This is what I see with Ortofon OMP40:

Before I was given the cantilever resonance explanation, I thought the FR rise from 10kHz to 20kHz is the LRC one, as the cartridge is loaded with 47kOhm||280pF.
Before I was given the cantilever resonance explanation, I thought the FR rise from 10kHz to 20kHz is the LRC one, as the cartridge is loaded with 47kOhm||280pF.
@Hans Polak
Are you quite sure that there is no series resonance in the range between 120kHz and 200kHz? If there is, then the following model is perfectly valid.
And the Shure V15 III is ideally suited for Rterm up to 150k, even Shure writes that even with a large Cterm and 70kOhm there are no audible negative effects.
In the picture 150k || 22p!
So all the fuss from the seafaring nation is nonsense. What remains is the mechanics, and you can't even grasp this with your means. Or can you? Then please explain it in detail - and above all credibly.
kindly,
HBt.
Attachments

Interesting,
but how does one explain the linear increase of k2 and k3 from 300 Hz to 10 kHz (plateau) in the log plot? Does the fidgeting on the branch rising from 6 kHz in the FR plot bother you?
Are these really the superpositions caused by mechanical vibrations in our bent tube? A very short piece of aluminum with perhaps 30nm^2 of cross-sectional area and an elastic modulus of 70 GPa?
🤔
I do not know.
For now - I'm trying to deal with the undamped 13Hz resonance. As it is - I had to increase the VTF from vendor-recommended 15mN to 22mN to be able to track 28cm/s @1kHz. I hope to return to the recommended VTF with the tonearm properly damped. May be then (under the recommended VTF) the k2 and k3 plots would look differently. As of now - under 22mN - the moving iron is not centered in the armature, whereas under 15mN it is well-centered.
For now - I'm trying to deal with the undamped 13Hz resonance. As it is - I had to increase the VTF from vendor-recommended 15mN to 22mN to be able to track 28cm/s @1kHz. I hope to return to the recommended VTF with the tonearm properly damped. May be then (under the recommended VTF) the k2 and k3 plots would look differently. As of now - under 22mN - the moving iron is not centered in the armature, whereas under 15mN it is well-centered.
One of the artificially induced points of contention is the above (very well-known) picture from the mid-1970s. Perhaps it shows the infamous Shure, an Ortofon or a Philips MM system. It is important to know that the achievable upper cut-off frequency is a mechanical resonance. It is formed by the complete mass of the stylus (the tongue, cantilever) and the elasticity of the record groove. Of course, the stylus cut and the contact force must not be forgotten. In other words, the scanning capability above 6 or 10 kHz, for example.
With regard to THD in this frequency range, the observation and empirically supported assumption, which is now over 50 years old, can also be repeated endlessly: it is causally related to the “mechanical impedance” and the necessary sampling capability of the system at high signal modulation frequencies.
Finally, there is a mechanical-electrical converter.
Two sides of the coin:
mechanical and electrical!
- Home
- Source & Line
- Analogue Source
- I'm interested in RIAA preamps design