There are hues of color which are apparently identical but have quite different spectral composition. Yet, because the way the eye sees the colors we perceive them identical.
In the same manner there are sounds/tones which are perceived identical but in time domain (i.e. f(t)) can look very different.
Therefore audibility of the difference between the shape of input signal and the output can't be reliably judged based on time domain charts.
We listen by ears, not by watching osciloscope.
Last edited:

seems to have clearly described the measurement processSo 30volts input to an amp, and 30mv out? What else have you fudged? The output looks like its slewing, probably input overload. Ild love to see what D Self would say.
I just tried to complement Graham's idea and show that the distortions of the first period are related to the group delay and its behavior in the frequency domain.
Attachments
Last edited:
Petrov, let me summarize what I understand.
Since you show no interest in measurement of real amplifier, FCD is a virtual distortion number arising from a technique utilizing stepped sinewave input that you find useful in Microcap to indicate shortcoming in GBW, propagation delay, slew rate and probably a few others. I think it could be appreciated when posted in software forum because it should work for tubes, solid state and chip amps.
You have to understand that simulation result is at best an indication but never measurement. Common acceptance of FCD as indicator of quality of an amplifier do require that FCD brings something new not covered by established known parameters, real measurement of the amplifier, comprehensive interpretation and correlation to perception.
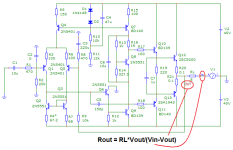
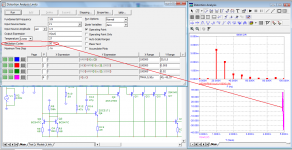
Hopefully it is not necessary to explain that the output impedance of the amplifier is connected in series with the load and affects the distortion on the load.
As you can see, there is no first period that so annoys many
Here is the behavior of the output impedance of two amplifier options when testing it from the output side:
original scheme of Douglas Self and modified version by Graham (see above)
You do the interpretation of the results yourself, because I misinterpret in the opinion of some colleagues
I have simulated a modified version of Self's Invariant Load Amplifier with sine wave and square wave input signals. Taking these in order I ran the a 20kHz signal input with a reactive load of 8R with 2uF in parallel.
The image attached confirms your observations - the period involved at start up being approximately 5us at a level of off around 7V.
If I run a 10kHz square wave test input for that same length of time the leading edge has no real deviation from vertical up to 14-15 V in term of frequency flattening off at 18V.
5us equates to 200kHz so there is a vast difference between the tests - so what is involved in each of these.
LT Spice allows 262144 sampling points so how much processing capacity is involved for each of the two tests.
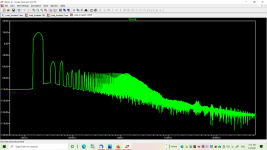
It is possible to get some idea with sine wave since FFT plots are a reconstruction of the sine wave sampling - so I have attached an image which looks like a lot of grass.
Looking at a square wave there would be far fewer vertical points to be sampled for rise and fall even allowing for some curvature at the top and bottom while the horizontal planes top and bottom would constant for most of the time.
Attachments
TNT, microap version 9 works the same for any period
Sorry - dont understand. Please comment on my other statement in my last post.
Here is a picture what I mean. Onset of the cycle train shows a "soft" start in first cycle - den nothing. So what is the problem for music listening here? Do please tell? Are you so in a hurry that you cant wait for the GD? Missing the train?
//
Sure Jan. The definition of lying contains a prerequisite of an intention to deceive. I don't believe petr_2009 has any intention to do that.
Maybe not. I've seen some graphs that look photoshopped or 'constructed' to me. But I may be wrong.
Jan
What charts seem to be changed to you? I can perhaps clarify the situation as I am familiar with these experiments.Maybe not. I've seen some graphs that look photoshopped or 'constructed' to me. But I may be wrong.
This one for instance had me scratching my head. No idea what it is.
Seems a bit of copy/paste. Post 876.
Jan
Seems a bit of copy/paste. Post 876.
Jan
Attachments
Last edited:
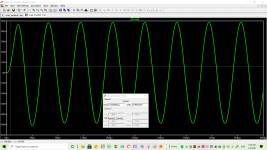
Petrov tried to show that the simulator analyzes the first period captured in the time window, so he manually glued several first periods in a row. In fact, only the first period is distorted there, and then the amplifier goes to the mode and visually nothing is noticeable.This one for instance had me scratching my head. No idea what it is.
Such a signal, as Petrov drew, can be obtained if there is a function gap between each period. But in this case, he was just trying to express his idea, which he did badly, I must admit.
Anyways - you show a first cycle with "distorsion" and then it goes away (?).
So lets say there exists a "1st cycle" problem - a first cycle only occurs in the start of every song - say 8 songs per CD.
Onset of the cycle train shows a "soft" start in first cycle - den nothing.
So what is the problem for music listening here? Do please tell?
Are you so in a hurry that you cant wait for the GD? Missing the train?
No, this happens on every "1st" cycle (on every "new borning", not yet-steady-continuous signal).
This sine burst method is just an extreme case to magnify the phenomena starting it from 0.
But of course it happens whenever there is a new signal (without "equal level" history) specially
having a high frequency and amplitude content.
But as I saw now, it's only relevant/visible if the GD is terrible related
to the speed of the applied signal. (SR vs GD mismatch problem)
Last edited:
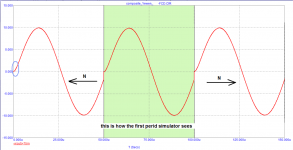
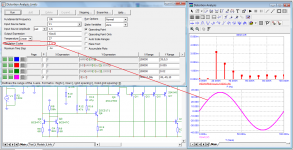
it feels like no one understands how the simulator works
In the settings window, set the number of periods for calculation
The program uses only one period for analysis - the last one, and makes a periodic signal from it for Fourier analysis
I hope so clear?
Cortez, SR and GD are speed parameters, they are related
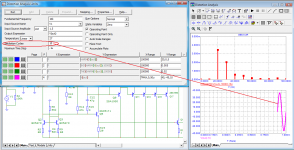
In the settings window, set the number of periods for calculation
The program uses only one period for analysis - the last one, and makes a periodic signal from it for Fourier analysis
I hope so clear?
Cortez, SR and GD are speed parameters, they are related
Attachments
Last edited:
It's the only way you can get it to analyse the first cycle? I think most understand that but they are saying, it doesn't happen and so what if it did, you wouldn't hear it anyway.
Last edited:

Why haven't you answered this question?
Petrov: what do you say? Can you show an example when there is FCD
present with a normal starting speed signal in a well designed average amplifier?
Sorry, I wasn't precise with this, what I was thinking was: input signal's SR vs amplifier's GD.Cortez, slew rate and group delay are speed parameters, they are related
So if an unfiltered test signal is too fast for a slow amplifier then is this kind of distortion significant.
But of course in general: the smaller the GD the better (in general, if everything other is OK).
Cortez, slew rate and group delay are speed parameters, they are related
No they are not.
Maybe not. I've seen some graphs that look photoshopped or 'constructed' to me. But I may be wrong.
Jan
I agree... yet was his underlying intent to help us understand his view or to deceive us. Such evidence is in context with everything else that we as individuals are aware of about an individual, that in turn is in totality what forms our independent (and often variant) conclusions.
I don't think it's hard to understand his intention at all...
The GNFB has a settling time (which causes error at the output) when doing it's job on a
transient signal with some delay, which we can "miss" if we look at it just after this settling time.
And with this FCD kind of presentation method it's visible + and virtually
measurable at the very beginnig on the first period.
It was done on a sine just because it gives THD numbers which we are used to.
It was started from 0 with an unfiltered speed just to magnify the effect.
It was done in the simulator as it can simulate a THD measurement even on one period of a signal.
And it was mentioned because some designs sometimes forget about the relevance
of the GD specially as they still could have some very good (average) THD numbers.
I guess that's all.
- Home
- Amplifiers
- Solid State
- First cycle distortion - Graham, what is that?