I truth a $25 USB audio stick is adequate for most speaker testing.
Any $1 USB soundcard is convenient and useful for nearly all general valve amplifier restoration/fault-finding/testing activities, and especially the guitar amp area. A 10:1 or 100:1 oscilloscope probe and BNC interface/coupler is the only real cost, and that can be about $25 for a new 100:1 clone probe. A little DIY is typically needed to AC couple the soundcard line out, and raise the line in impedance to about 1Meg, and to set the probe compensation capacitance. Another $25 for a USB isolator is practical when using a mains powered PC.
Any more exotic than $1 extends the USB soundcard to 96kHz sampling, but tends to make DIY harder as the pcb and smd parts get smaller.
The noise floor is typically well below any valve amp, and low frequency response can go below 2Hz.
It seems that many amp enthusiasts never take the leap of faith over to digital due to the perception of computer, audio driver, and soundcard hassles with anything but a professional probe/soundcard/software 'oscilloscope' package, and so many just save up for a Rigol if they want spectrum analysis. I think many enthusiasts are likely to appreciate how to use LTSpice more so than a spectrum analysis tool.
I think you're exaggerating just a little bit about a USB sound card being $1. You may have found one on Ebay, but the average price for a USB sound "card" is somewhat higher and probably around the $25 figure noted above.
I would hesitate to connecting a $1 anything to a USB port unless I was scoring something worth a lot more. Then you really can't compare the $1 price tag.
I don't know how to use any spice programs. I typically go from paper drawings right to schematic capture, then the PCB artwork. It takes time to do things this way, but not as much as the good drawings I had to do in the past. I view DipTrace (or any other you might prefer) as the most valuable way to spend some $$. My stuff usually works the way it was designed with probable component value changes, but that is what the prototyping step is all about. I don't tend to use the auto router in these packages though. I don't trust them to get it right.
-Chris
Hi Chris - yes new USB soundcards are under $1 on eBay, and China pays the postage as well. I was recently trying out the more 'exotic' $7 types that support 96kHz. A Uni tutor got in touch for help a year or so ago as he had a 'prac' converting them to use for oscilloscope/spectrum measurement. I had been looking at ways to clip any over-voltage, but nowadays just use a standard 100:1 probe.
Hi trobbins,
I figured they had to be Ebay from China. I have personally never seen any for that price, but I'm sure they are there.
-Chris
I figured they had to be Ebay from China. I have personally never seen any for that price, but I'm sure they are there.
-Chris
Analyzer Software Comparison -> divergent results???
Hello!
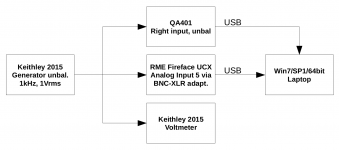
While the RTX is beeing assembled in denmark I spent sevral days setting up a new laptop (for audio analysis only). Today evening I tested several software packages in parallel in order to compare the results with the QA401 analyzer. Please have a look at the test setup and result summary (.pdf) attached.
The target of this test was to estimate the accuracy of the software and hardware used. Interestingly the results deviate quite a bit. This surprises me, since I gave my best to achieve comparable settings. Especially for the soundcard based measurements, which share the same hardware.
I am quite disappointed, that the results are THAT unreliable. This is not a THD-measurement, that is THD-guessing. I even doubt, that the QA401 figures are accurate.
Next step would be to record a 1second .wav-File and hack some code, that does the FFT analysis. This way I could learn more about the FFT-details and pitfalls.
Hello!
While the RTX is beeing assembled in denmark I spent sevral days setting up a new laptop (for audio analysis only). Today evening I tested several software packages in parallel in order to compare the results with the QA401 analyzer. Please have a look at the test setup and result summary (.pdf) attached.
The target of this test was to estimate the accuracy of the software and hardware used. Interestingly the results deviate quite a bit. This surprises me, since I gave my best to achieve comparable settings. Especially for the soundcard based measurements, which share the same hardware.
I am quite disappointed, that the results are THAT unreliable. This is not a THD-measurement, that is THD-guessing. I even doubt, that the QA401 figures are accurate.
Next step would be to record a 1second .wav-File and hack some code, that does the FFT analysis. This way I could learn more about the FFT-details and pitfalls.
Attachments
Some interesting results there.
I'll try some tests of my own tomorrow and see what I come up with, although I only have a FocusRite Scarlett 2i2 (gen 2) but the distortion specs on that seem pretty good.
I have also used this Perl script that I found on Github that measures distortion, it might be worth a try for your tests.
I note that with RMAA I often see vanishingly low distortion measurements as well.
I have seen similar issues comparing different software and devices. There are a few bigger issues like rejecting the skirts of the fundamental. This may be an issue in the QA401. Others have to do with the RMS sums of the noise and the rms sums of the harmonics. Then the bandwidth of the measurements.
I'm thinking a specific test signal with known harmonic levels that are high enough to not have interactions with the internal harmonics of the DAC or ADC would be the next step.
A validation routine would like like this:
1) calibrate sensitivity with a known 1KHz signal
2) measure noise floor in a known band with
a) ADC input shorted
b) DAC connected to ADC and DAC at digital zero
3) loopback with test signal with 5 harmonics all at -70 dB
4) Test with ultra low distortion external oscillator
This should create a baseline and show where the systems will disagree on signals.
I'm on the road until next week but I'll be happy to try these on the RTX and all the other soundcards I have. I'm open to suggestions. I'll also do loopback with RMAA for another easily shared reference point.
Last edited:
Hello!
<snip>
I ran some tests this morning.
I don't have access to a low distortion oscillator, so I used WaveGene or the app's inbuilt oscillator.
All levels were set to -11dB to match yours, and I did my best to match other parameters where I could.
I had an issue with Arta - I forgot to capture the screenshot for the Hanning mode - and when I restarted Arta to try again - I could not get a clean spectrum at all - I even tried to reboot the PC but no luck.
Audio Tester has no cursors (that I could find) so it was difficult to see what the readings were at different frequencies - I exported the data to a file, but the levels were way off, so I'm not sure what went wrong there.
If I understood your document correctly, it looks as though you had a difference in levels in some of your tests.
I couldn't find an easy way to get my Excel spreadsheet into a PDF (the images were too large to use my usual PDF printer) and trying to convert it to Word made me lose the will to live - so attached is an Excel spreadsheet.
Attachments
Last edited:
For my opinion, you must calibrate the input signal each time to change software or hw.
From the ARTA datasheet that I know, the software suggests Kaiser7 (or Kaizer5) window for the THD measurements, not Hanning or FlatTop.
From the ARTA datasheet that I know, the software suggests Kaiser7 (or Kaizer5) window for the THD measurements, not Hanning or FlatTop.
As an update to my post #89 above.
I measured again - this time using -1dB as a reference calibrated via my 'scope.
It would appear that I do not have AudioTester's export feature configured correctly, so I could not obtain proper results from the exported data.
This time I managed to get it all into a nice .pdf file.
The noise problem I had with Arta earlier appears to be down to an Asio issue somewhere, as reverting to the WDM driver resolved the issue.
Attachments
In addition to the above - this is the output of the "DistortionsAnalyzer" Perl script I made reference to in post #86.
I have made a few changes to the script (just cosmetic, fixed some spelling errors and enhanced the graph output).
Please see attached .pdf for measurements.
If I'm not mistaken, the author of this Perl script "misterzu" is a user on here.
I have made a few changes to the script (just cosmetic, fixed some spelling errors and enhanced the graph output).
Please see attached .pdf for measurements.
If I'm not mistaken, the author of this Perl script "misterzu" is a user on here.
Attachments
@tony: Thanks a lot for your work. Your soundcard seems to be quite good!
Today I had a rough look at THD only. As suggested from 1audio, two .wav files with dedictad harmonic content were generated and sampled by the test setup described before.
The levels were "calibrated" for all software packages, exept Wavespectra that displays dBFS - no matter what options I choose.
This time I focus on the Hanning window (only for reference, probably there is a superior one for THD measurement), while keeping the 48kHz sampling frequency (the QA401 application does not show THD+N with 192k and external generator signal).
The THD results are similar this time, especially for the high-distortion signal. It seems, one of the major issues is the way the software identifies the harmonics and their amplitudes. Arta seems to reference THD strictly to the generator signal (fundamental frequency).
As soon as possible, i will have a look at THD+N and the calibration of the Noise measurement described above.
After that we could probably focus on the FFT parameters, i.e. which window function, fft-length etc.
Today the pdf-summary without layout-errors. Comments welcome
Attachments
Reviewing the results above.... I must admit, that choosing the Edirol for playback was probably not a good choice. It introduced some odd peaks at similar levels and the harmonic amplitudes are not equal.
I should try using a better DAC for the source. Souncard, portable player or maybe even a CD player for playback?
I should try using a better DAC for the source. Souncard, portable player or maybe even a CD player for playback?
First point is the fit of the harmonics to the FFT bins. That can mess things up especially with different windows. there are other issues like frequency stability etc. that will have an impact. If the harmonics in the signal and the harmonics in the system are close in amplitude they can modulate each other with phase relationships. Usually at -100 dB or less. That's why I suggested -60/-70 db. When I get home I'll try the same tests and also put an analog analyzer in the middle to check the ADC harmonic output.
about error of THD
The programmer of Wave spectra writes comment (unfortunately for many written in Japanese) about tolerance of THD and THD+N because he received many E-mail claiming the result was incorrect.There are probably 3 major reasons.
1. bin of FFT.
When you use 1kHz with 48ksample and FFTsize of 4096, you can't use exact 1kHz because of limitation of bin. 1kHz in FFT means (48000/4096)*85=996.09375Hz.FFT unavoidably treats this as 1kHz. This difference becomes error.
Wave Gen, which is also programed by the same person of Wave Spectra, has special function to avoid this error. Right click on the frequency button can change the frequency into exact multiple of bin. You can decrease the tolerance of THD, using exact multiple of bin.
2. windowing
The skirt of fundamental frequency depends on windowing a lot.This is also the reason of tolerance, especially THD+N.He says THD is usually less than real value, THD+N is more than real.I roughly estimated THD and THD+N from your attached file. THD is about 0.03%,THD+N is 0.033%.The measurement of WaveSpectra is 0.02414% and 0.05278% from your ZIP. He says
Flat Top is the best for decreasing this error.If you use the frequency of multiple of bin, you can use rectangular window(this means no windowing).
Rectangular has neither windowing related error nor bin related.
3. FFT size
The larger FFT size, the less error.Large size FFT can reduce the effect of 1. and 2. But it sometimes results in error when frequency is not multiple of bin.
These are major reasons of error.I think software has limitation. Plug & Play is convenient but sometimes inaccurate. When I want to get accurate data, I usually use RX4 (iZotope) to measure THD+N. I need to remove unwanted spectrum manually. When I want rough measurement, I use software.
As an update to my post #89 above.
I measured again - this time using -1dB as a reference calibrated via my 'scope.
It would appear that I do not have AudioTester's export feature configured correctly, so I could not obtain proper results from the exported data.
This time I managed to get it all into a nice .pdf file.
The noise problem I had with Arta earlier appears to be down to an Asio issue somewhere, as reverting to the WDM driver resolved the issue.
Noise level close to -140 dB!? Really?
Noise level close to -140 dB!? Really?
I know lol - and I doubt it....
Even Focusrite quote -106dB (A Weighted) for the line input on the Scarlett 2i2.
I've often wondered how the software determines it's ~-140dB
I do run the input gain very, very low though, to maximise the SNR.
I know lol - and I doubt it....
Even Focusrite quote -106dB (A Weighted) for the line input on the Scarlett 2i2.
I've often wondered how the software determines it's ~-140dB
The software magically reduces the noise floor by 30 dB or so? I'd say this is cheating.
Is it some kind of "aritifact" related to long test signals so that noise is getting averaged out? This would probably mean that the frequency bins are larger than the frequency resolution corresponding to the length of the test signal. But I have no idea how these software packages work, and how they were configured.
I certainly have no idea.
Maybe someone else here does though?
Apart from bode plots, I tend to take most PC measurements at 'face value'.
Maybe someone else here does though?
Apart from bode plots, I tend to take most PC measurements at 'face value'.
- Status
- Not open for further replies.
- Home
- Design & Build
- Equipment & Tools
- Analyzer Software Overview