What kind of active system was it? DSP on each channel or just analog crossovers prior to amps?
I use a MiniDSp and Behringer amps with DSP. There is always a cap in series with the CD for safety (as small as practicable) and this has to be part of the crossover, so it's a mix of analog and Digital.
I see, so you actually are able to do a fair bit of correction then. I had always thought that this kind of approach would actually sound much better!
Not my experience, but yes, it very well could on a bad set of speakers without a proper Xover design. And they are fast and easy to implement in software. Just a PITA in hardware.
PS. Let me clarify a little. I had a target response that I wanted to achieve and was able to for the most part passively. A little complex, but doable. What I could achieve with active was closer to target, but not that much different from the passive approach.
PS. Let me clarify a little. I had a target response that I wanted to achieve and was able to for the most part passively. A little complex, but doable. What I could achieve with active was closer to target, but not that much different from the passive approach.
Last edited:
I find it odd that you would use a cap in an active system.
Would a transformer give better damping?
Would a transformer give better damping?
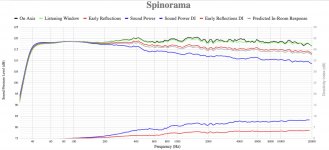
That's a good question, but hypothetical. As it stands with this data, it looks to me like a non-rising DI is preferred. Doesn't that support my contention? A few dB rise is fine, but smoother and flatter is still the goal.
The mid-range diffraction in the first speaker above is very pronounced. I would suspect this to be an audible problem. The second one also has the lowest diffraction, which should also add to its preference.
Hi,
As I have been following this thread with great interest (Matbat, truly great job BTW) and I was waiting for the DI conversation to happen.
I may have some ideas to share in relation with the Olive Predicted Preference Rating (PPR) aka the Score vs DI.
Regarding the Olive scoring method itself, models in general, not just in audio, are judged with two main criteria:
- Can it describe what we observe reasonably well?
- Do the predictions derived from the model hold against new observations?
The first criterium is covered in depth in the original paper:
https://www.researchgate.net/public...e_Ratings_of_Around-Ear_and_On-Ear_Headphones
However, we need more data for the second criterium to be more understood.
We have some data point from the Harman team comparing different speakers with different In-room response shapes and EQing targets but this definitely not as detailed as the first paper.
One may not agree (whatever that means) with the Score but this is the best we’ve got.
Nothing is preventing anyone from coming up with something different but the validation will be hard to say the least…
We can partially check the predicting power of the model and check how it holds up.
The generalized preference score Equation is:
PPR_ON = 12.69 - 2.49*NBD_ON - 2.99*NBD_PIR - 4.31*LFX + 2.32*SM_PIR;
PIR: Predicted In-room Response. Vey similar to the ER (Early Reflection from Toole).
ON = On Axis, reference angle of the device.
If one ignores the LFX (low Frequency Extension, see the paper form details) to avoid over-stretching the speaker and compare them pound-for-pound within they SPL limits, or latter on add multiple LF sources, then the score driving factor is the PIR. One should therefore design the speaker with the PIR as priority.
This is linked with the research based on the in-room EQ AND the headphone target curve research both conducted by Harman.
“My” Interpretation to use the model and extrapolate some predictions:
a. - 2.49*NBD_ON (100Hz-12000Hz): Narrow bandwidth Deviation (see the paper for the details), the score benefits from a flat response with as little deviations from the average value as possible; we want NBD_ON=0.
Even adding a gentle slope would not result asymptotically in NBD_ON=0.
However, having the curve that looks like some stairs on each 1/2 octave band could yield 0 as well; not that I advocate this kind of design it is just a remark…
b. - 2.99*NBD_PIR (100Hz-12000Hz) same as NBD_ON, we want NBD_PIR=0
c. - 4.31*LFX: we want 4.31*LFX = 0 which means a 6dB cut-off of the SP to be 1Hz (or lower) relative to the average of the ON response in the 300-10000Hz range.
If one wanted max Score = 10 (not sure why but let call it a convention for now) then the LFX should be f6dB = 14.5Hz.
d. + 2.32*SM_PIR (100-16000Hz, see the paper for the details), interpreted as the SMoothness of the PIR is comprised between 0 and 1, we want SM_PIR = 1.
To calculate this property of the PIR, first, one needs to make a LINEAR regression of the PIR, and then, the SM expresses the validity of this regression. It is the Coefficient of determination.
The more the PIR resembles the LINEAR regression, the closer to 1 the SM_PIR will be.
The PIR should therefore be a LINE with a slope, ANY slope. From this we can see that we have some preference for a certain shape for the PIR which is somewhat consistent with the Harman study on in-room response. BTW, this eliminates the stairs “case” from the NBD, as, in all likelihood, the derived PIR would not resemble a line.
This leads to design considerations on the target one should follow to achieve the best score possible:
* NBD_ON = 0 translates into Flat for ON, OK nothing new there.
* LFX: 14.5Hz, more reasonable that 1Hz… Doable with dedicated and distributed SWs and EQ
* SM_PIR = 1 means PIR is a line with with a slope, ANY slope. Now, knowing that we also want NBD_PIR = 0 it means that the PIR should therefore be a FLAT line i.e. slope = 0.
* NBD_PIR = 0 translates into Flat for PIR,
Remember PIR = 0.12*(listening Window, LW) + 0.44*(Early Reflexion, ER) + 0.44*(Sound Power, SP).
Then a flat PIR also “probably” means
* Flat LW
* Flat ER
* Flat SP
So now we have the “idealized” targets:
* Flat ON: not a surprise
* Flat LW: no variation on the tonal balance across the LW, not a surprise, directivity appears here.
* Flat ER: no variation on the tonal balance with the ER, not a surprise, directivity appears here.
* Flat SP: so fLat DI as well
Now how does one make such a speaker, at least on the horizontal plan?
* Controlled and constant directivity down to 100Hz via large drivers, waveguides and/or beam forming
Bang & Olufsen BeoLab 90 loudspeaker Measurements | Stereophile.com
Dutch & Dutch 8c active loudspeaker system Measurements | Stereophile.com
Kii Audio Three loudspeaker Measurements | Stereophile.com
Another good approximation:
https://3.bp.blogspot.com/-OB4hm25dXms/XJVUs8TznTI/AAAAAAAAAEA/r6riUCqhZDgJO61yR8uKzWXbHDYsl_CJgCLcBGAs/s1600/Spin+-+Revel+Performa3Be+F228Be.png
That is also the target for Earl Geddes if I am not mistaken the difference being the DI value more of less high i.e. reflection contribution vs time.
Onmi-directional is a special case of this that might requires multiple HF sources to extend the omni character up to HF
https://www.audiosciencereview.com/forum/index.php?threads/canon-s-50-wide-directivity-speaker-review.13982/#post-426447
This is a very old debate that I do not pretend to solve here but that seems to tilt the balance towards constant directivity (Flat SPDI) vs monotonically increasing directivity i.e. a SPDI that increases consistently with frequency.
The latter can provide:
* Flat ON, OK for NBD_ON = 0
* Tilted LW with built in issue with NBD_PIR = 0
* Tilted ER with built in issue with NBD_PIR = 0
* Tilted SP with built in issue with NBD_PIR = 0
* Tilted PIR with built in issue with NBD_PIR = 0 but with no reason NOT to achieve SM_PIR = 1 target
Example of such an approximation:
https://speakerdata2034.blogspot.com/2019/03/spinorama-data-kef.html
With all that been said, the score relies on anechoic data that does not include the room influence per definition.
So I guess one way to see things would be to stick to the these anechoic targets within the limits of room/speaker dominated domains
Therefore we could restrict the target to the Schroder frequency (which one?) 500Hz as most large speaker Summa, JBL M2 or ? to get a reasonable approximation of the design targets.
The model limits may or may not fully understood but one of the issues might be the PIR preferred vs the way the model works, the preferred PIR switched from a line with a slope to something different as Harman progressed, see the 3rd edition of the Toole book too.
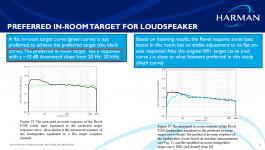
check the PREFERRED IN-ROOM TARGET FOR LOUDSPEAKER.png attached

Spinorama of the F206: https://2.bp.blogspot.com/-xqKYdRmEzKk/XJVUr5bdR6I/AAAAAAAAAD0/nxBS8IBGnLwrq86HJeqn9MAn6QTFSw8aQCLcBGAs/s1600/Spin%2B-%2BRevel%2BPerforma3%2BF206.png
The catch is that most speakers do not have controlled directivity down to 100Hz therefore the PIR regression being linear, the score tends to favor a line with a negative slope (-6/-10dB from 100 to 16000Hz) although, at the limit, it would favor a flat PIR as seen above.
Even speakers with CD much lower that usual say 200-300Hz to will still yield a slope for the linear regression and score lower while they are closer to the idealized target. i.e. the Revel Tower speakers F228 as the example showed above.
https://www.stereophile.com/content/blind-listening-harman-international
One example is the
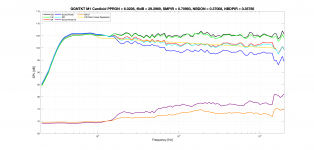
GGNTK M1 in cardioid mode Spinorama I have generated attached with score and attributes in the title. The PIR regression does not fit the PIR well although it looks like it is a better approximation of the preferred In-room response
vs
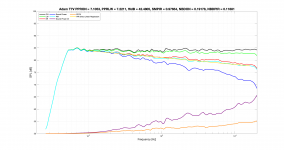
The EQed Adam T7V (EQed) almost text book slope. Spinorama I have generated attached with score and attributes in the title
Unless some modifications are made to the model (and validation) that’s the way it is.
EQing:
Matbat said he wanted to see the speakers equalized to flat LW, I have published numerous examples of that on ASR and some were (casually) tested.
I have written Genetic Algorithm based optimizer in Matlab that can design flat LW EQ and also can optimize for the score directly.
Form my admittedly casual experience (and some people who ave tried the EQs it generated) some trends:
- flat LW tends to be too bright
- Score based optimization: hit and miss
I then made a third version (which is evolving as I get feedback from users) that looks at both strategies simultaneously and seems to yield more consistent and favorable results.
What I do, which is not the end of it all:
1. The LW EQ is using a fixed target aimed at making the LW flat regardless of any other concerns. I do this because the LW flatness is highly correlated with preference in the Olive study and this is easy to understand. This would normally result in a flat tonal regression for the LW and probably slightly ascending ON regression.
That is what most, if not all, the other optimizers are doing: set a target and fit it be it for PIR, ON, LW, in-room, etc.
It is not sufficient *generally* as some aberration only found ON/near axis may result in weird EQs for example Kali IN80 with the coaxial tweeter.
On the other hand, If one were to EQ on score alone as I tried the results may look also quite funny, boost around the Xover point to fill the directivity errors + decrease HF to get the steeper slope on the PIR + unreasonably boost at LF if left unchecked .
These EQs are similar to EQing to a pure slope PIR.
2. The Score EQ starts from the LW EQ and adds the score into the optimization process so that, theoretically, the directivity is taken on board and the EQ does not try to correct things that should not be or at least tries to reasonably correct them. *There is no fixed target anymore*.
Many speakers will end up with a (close to) flat ON regression but some won't because of their directivity and/or because of the "aggressiveness" of the EQ. The "aggressiveness" level is set by the LW EQ: if the EQ LW complexity can deliver a reasonably flat LW, then it should be a decent starting point. The LW/PIR/SP usually end up having a negative slope similar to the ones observed is the Olive study.
In all cases this not a target that I set but I'd say that speakers with reasonable directivity will tend to end up close to flat ON though.
Sometimes the results are easy to understand but sometimes the deviation from flatness is so large (or so small) that the interpretation becomes difficult without listening trials.
*In my opinion* some speakers must be voiced (designed with deviation from flat) to be optimized and compensate for their directivity errors.
My optimizer is specifically designed for that, finding the flattest response that maximizes the preference score in the *general* case.
Does it achieve this goal not sure... some designs remain problematic, I suspect this has more to do with with the score limitations than the optimizer itself. These edge cases are the most interesting of course but modifying the score is a huge task.
BTW the discussion regarding other factors from the paper is quite interesting:
[…]we found that timbre-related attributes accounted for 94% of the variance in comments whereas nonlinear distortion and spatial-related attributes only contributed 3% each. It is our experience that timbre is the dominant factor related to loudspeaker preference, and speakers that accurately reproduce timbre generally have favorable spatial properties.[…]
Sorry for the long post, most of it is copied-and-paste from some of my posts on the ASR forum but it might be helpful for some.
M
Attachments
Last edited:

I find it odd that you would use a cap in an active system.
Would a transformer give better damping?
I do not understand why a transformer would have "better damping", nor do I see how this is a factor for a CD. I have never understood the idea of a transformer for the CD. And it won't actually do any protection of the driver, unlike a small cap.
Hi,
As I have been following this thread with great interest (Matbat, truly great job BTW) and I was waiting for the DI conversation to happen.
I may have some ideas to share in relation with the Olive Predicted Preference Rating (PPR) aka the Score vs DI.
Very informative discussion. Thanks. A lot to digest, and I'm not sure that I follow all of it, but I clearly understand what you are trying to do.
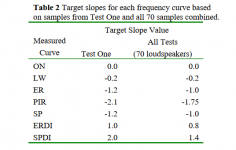
The same with me. What catched my attention this time is this quote from the Harman study (page 6):
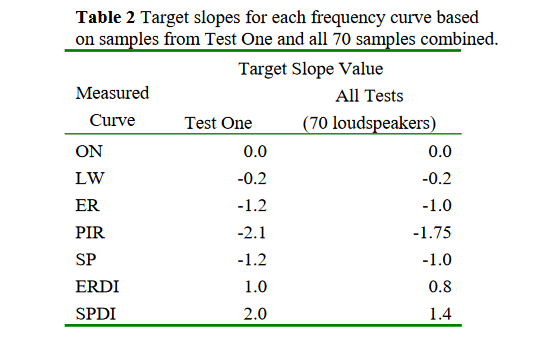
"... Target slopes were determined separately for Test One and for our larger test sample (70 loudspeakers) used for the generalized model described in section 5. The target values are based on the mean slope values of speakers that fall into the top 90 percentile based on preference ratings. Target slopes are defined for each of the 7 frequency curves (see table 2). The ideal target slope for the on-axis and listening window curves (0 and –0.2) is identical for both test samples, which indicates that the on-axis curve should be flat, while the off-axis curves should tilt gently downwards. The degree of tilt varies among curves for Test One and the larger sample. [...] This suggests that the ideal target slope may depend on the loudspeaker’s directivity."
If I understand the units in Table 2 (see Eq. 5), for the PIR ("predicted in-room") slope this would be a downward tilt around 4 dB between 1 - 10 kHz (and around 2.5 dB for power response alone). Is that right?
Of course this may be due to the fact that no other loudspeakers (i.e with more flat, and maybe also higher, DI) were present in the test. Would loudspeakers with more flat and high DI be rated even higher in this test? That's what we still don't know, I think.
Attachments
Last edited:
Please remember that this is still only an assumption of the model, not an outcome.b. - 2.99*NBD_PIR (100Hz-12000Hz) same as NBD_ON, we want NBD_PIR=0
The same with me. What catched my attention this time is this quote from the Harman study (page 6):
"... Target slopes were determined separately for Test One and for our larger test sample (70 loudspeakers) used for the generalized model described in section 5. The target values are based on the mean slope values of speakers that fall into the top 90 percentile based on preference ratings. Target slopes are defined for each of the 7 frequency curves (see table 2). The ideal target slope for the on-axis and listening window curves (0 and –0.2) is identical for both test samples, which indicates that the on-axis curve should be flat, while the off-axis curves should tilt gently downwards. The degree of tilt varies among curves for Test One and the larger sample. [...] This suggests that the ideal target slope may depend on the loudspeaker’s directivity."
If I understand the units in Table 2 (see Eq. 5), for the PIR ("predicted in-room") slope this would be a downward tilt around 4 dB between 1 - 10 kHz (and around 2.5 dB for power response alone). Is that right?
Of course this may be due to the fact that no other loudspeakers (i.e with more flat, and maybe also higher, DI) were present in the test. Would loudspeakers with more flat and high DI be rated even higher in this test? That's what we still don't know, I think.
Just a point there:
It is believed that the table is wrong: probably a clerical error that swapped the SP line and the PIR line.
1. The PIR and the ER are almost identical so one would expect their slope to be also quite similar
2. It seems odd that the slope of the SP is lower than that of the PIR
There are some open questions regarding the paper but for our purpose here we don't need to get into them.
b. - 2.99*NBD_PIR (100Hz-12000Hz) same as NBD_ON, we want NBD_PIR=0
Please remember that this is still only an assumption of the model, not an outcome.
I am not quite sure about the meaning of your sentence.
According to the model and ignoring LFX, if one wants to maximize the score then the target is to simultaneously
- maximize SM_PIR, the limit being 1 i.e. PIR is a line with a slope
- minimize NBD_PIR, NBD_ON the limit being 0 i.e. the PIR and the ON are perfectly FLAT line
Thats all I wrote.
Yeah, you are most probably right. As the PIR is a weighted sum somewhere between LW and SP, it should be the other way.Just a point there:
It is believed that the table is wrong: probably a clerical error that swapped the SP line and the PIR line.
My point is that even the best rated loudspeakers in that study didn't have flat power or in-room response (or DI for that matter). Yet the model simply assumes that the flatter the better. It can still correlate well for the particular set of loudspeakers (it could be simply because the flatter were also much smoother or with better LFX) but it doesn't necessarily mean that loudspeakers with "flat everything" would be really rated higher in actual listening tests. This is still only an assumption (and kind of extrapolation of the results) that was not experimentally tested.
Sure, that's what the model says, that's the assumption. But is that really true - is that really the optimum?I am not quite sure about the meaning of your sentence.
According to the model and ignoring LFX, if one wants to maximize the score then the target is to simultaneously
- maximize SM_PIR, the limit being 1 i.e. PIR is a line with a slope
- minimize NBD_PIR, NBD_ON the limit being 0 i.e. the PIR and the ON are perfectly FLAT line
Thats all I wrote.
Last edited:
maiky76, thanks for the elaborate post!
You've substantiated the blanks I fired previously concerning this subject.
One may wonder whether it's a coincidence that you are French 😉
You've substantiated the blanks I fired previously concerning this subject.
One may wonder whether it's a coincidence that you are French 😉
Last edited:
This is pretty much the benchmark for spinorama (Genelec 8341A SAM™ Studio Monitor).
Impressive, but keep in mind that these $6000 miniature monitor are not capable of achieving high SPLs.
Impressive, but keep in mind that these $6000 miniature monitor are not capable of achieving high SPLs.
Attachments
Last edited:
Its bigger sibling 8361. And then there are subs.
Peak SPL
≥124 dB
Short term max SPL
≥118 dB
Long term max SPL
≥109 dB
Maximum long term RMS acoustic output in the same conditions with IEC weighted noise (limited by driver protection circuit) at 1 m.
//
Peak SPL
≥124 dB
Short term max SPL
≥118 dB
Long term max SPL
≥109 dB
Maximum long term RMS acoustic output in the same conditions with IEC weighted noise (limited by driver protection circuit) at 1 m.
//
Could you name a few? I'm not sure I follow.You've substantiated the blanks I fired previously concerning this subject.
Curiously enough, the Genelec 8361A doesn't seem as nice as its smaller siblings. It's not obvious what's wrong but it seems that as you make an enclosure bigger, the same roundover is not good enough anymore (or as effective) as for a smaller one. At least that would be my guess.
https://assets.ctfassets.net/4zjnzn...8a62/genelec_the_ones_brochure_2019_web_0.pdf
https://assets.ctfassets.net/4zjnzn...8a62/genelec_the_ones_brochure_2019_web_0.pdf
I think I see what you mean - the relative narrowing at 1 and 8k? Do one hear that difference is the question?
/
/
There's simply more pronounced diffraction, which the narrowings you mention are symptoms of. The Olive's preference rating model suggests we do.
Curiously enough, the Genelec 8361A doesn't seem as nice as its smaller siblings. It's not obvious what's wrong but it seems that as you make an enclosure bigger, the same roundover is not good enough anymore (or as effective) as for a smaller one. At least that would be my guess.
https://assets.ctfassets.net/4zjnzn...8a62/genelec_the_ones_brochure_2019_web_0.pdf
I've been wondering the same thing:
Loudspeaker Enclosures are Waveguides
- Home
- Loudspeakers
- Multi-Way
- Acoustic Horn Design – The Easy Way (Ath4)