Could you draw a sketch?Would it be too much hassle to pinch the 2" throat to 1" and stretch the throat accordingly?
It is then of course no longer an OS throat, but I wonder what the sims would look like.
I will prepare a template ABEC project where you can easily try these things yourself. It's really not that difficult.
I agree. That is not what virtually all CDs try to do, so I don't see how or why this would be the case here. It seems to me to be almost impossible to achieve and almost as difficult to prove.
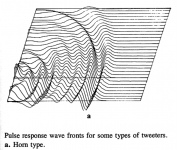
From the AES Journal, January/Februrary 1976:
Pulse response wave fronts of a compression driver + horn.
Looks pretty spherical to me.
Attachments
Could you draw a sketch?
I will prepare a template ABEC project where you can easily try these things yourself. It's really not that difficult.
On the road right now, so no workstation + CAD at hand, but I'll figure something out.
I'll send you an email.
A driver + horn, for sure (up to some frequency). But for the driver itself, it's unlikely....Looks pretty spherical to me.
I want to try this on a real driver some day.
please enlighten me here, what is it about that shape that makes you want to try it with a real driver? if there's no way to predict performance (or hear the results) what is it about this that make you feel it's worth pursuing?
I never said that it's not possible to predict (or measure) the performace or hear the results. I only said that I don't think it is "possible to convert the information obtained in a polar map(visual) into a audible algorithm for auditory evaluation". Maybe it is, I don't know. I'm just curious. If I would be satisfied with the first "good enough" solution I would have been done with it for a long long time...
i take it your misunderstanding me, i was just trying to ascertain if your experience with the creation of various curvatures and their end results was what prompted you to say "I want to try this on a real driver some day" as in previous experimentation is what lead you to the creation of this shape and more fundamentally, why?
"I want to try this on a real driver some day" - it means I want to try putting an open cell foam into a phase plug to taper the amplitude and see what could be achieved this way in a real world situation, including the waveguide. Why? Because I'm curious.
ok sorry for the questions you do have specific goals that i'm not aware of i was just curious myself!
A driver + horn, for sure (up to some frequency). But for the driver itself, it's unlikely.
Agreed.
I never said that it's not possible to predict (or measure) the performace or hear the results. I only said that I don't think it is "possible to convert the information obtained in a polar map(visual) into a audible algorithm for auditory evaluation". Maybe it is, I don't know.
Having done some auralization work, it is certainly possible, just not very feasible. It would take a team of competent software engineers to get it right considering that one would have to model the entire room to get the reflection patterns etc. Auralization of simple sources in rooms is being done all the time, but modeling a complex source is another degree of complexity that pushes it well past what we simple DIY people could do.
i was envisioning more an simple evaluation tool like an fir filter to emulate the transfer function of the horn/waveguide overlayed on an audio source monitored on headphones (no room needed as i would be interested to see if in sim mode one could hear changes made to the shape of the device first, admittedly introducing the room is a whole new world of hurt and confounding math!!)
Put a CD on a plane wave tube...Place N microphones at Xn distances. From the math you can find one mode for each microphone N...
I don't really understand, perhaps I have missed some vital point.
The input is a standard sine wave, stepped to test each frequency?
The measurements are amplitude and phase at each known distance Xn?
The plane wave tube has a limit below which it cannot support a transverse mode.
Are the Xn sufficiently small that you measure within the near field of some evanescent wave caused by wave front non flatness?
If not then...?
Seems relevant to the thread topic but if this is obvious to everyone else then sorry, perhaps you could spare Earl the trouble and explain it to me.
Best wishes
David
what does "mode" for each microphone mean? or should that read "node"?
I assume it's "mode".
The non flat wave-front can be analysed as the sum of a series of modes, a sort of Fourier analysis - but into spatial modes.
And, as usual in maths, as the number of unknowns increases we need more information to pin them down.
I think Earl's comment implies he assumes rotational symmetry.
IIRC some data shows the wave-front was not as symmetric as one would like, due to production imperfections in the driver and|or the plane wave tube.
Also IIRC some of that data was from Earl himself, so I am interested to read his comments.
Best wishes
David
I'd be interested as well. Earl already mentioned this idea years ago: Poor man's plane-wave tube?
I guess that gated impulse response(s) would be the input data.
I guess that gated impulse response(s) would be the input data.
Last edited:
I'd be interested as well...
Excellent, didn't want to sidetrack your thread if you weren't interested.
But I expected you would be because it is very relevant to the simulations.
That link was probably the one I had in mind for the "IIRC", thanks for the reminder.
Best wishes
David
I don't really understand, perhaps I have missed some vital point.
The input is a standard sine wave, stepped to test each frequency?
The measurements are amplitude and phase at each known distance Xn?
The plane wave tube has a limit below which it cannot support a transverse mode.
Are the Xn sufficiently small that you measure within the near field of some evanescent wave caused by wave front non flatness?
If not then...?
Seems relevant to the thread topic but if this is obvious to everyone else then sorry, perhaps you could spare Earl the trouble and explain it to me.
Best wishes
David
One could use a sine wave, but that would be inefficient since we would want to know how the curvature varies with frequency. I would use a broadband signal and something like HOLM to find the transfer function for all frequencies. In a PWT, there is no need for a window, so there is no LF limit.
The transfer function is complex so yes both amplitude and phase are measured.
There is a cut-off effect for a PWT below which only evanescent wave will propagate, but these waves still contain the information necessary. To what extent one can get good resolution of the curvature from the evanescent wave will be determined by the numerics and the SNR in the measurements. This is an implementation problem, not a theoretical one. But remember that there is also a cut-off effect for the waveguide itself so the evanescent modes will not propagate in the waveguide either, making them less of an initial right off the bat.
Location of the "ideal" measurement points would need to be investigated, but I would say that, in general, one would want to be in the near field of the device, at least as it exists inside of the tube.
By rotating the driver on its mount, the first rocking mode - probable one of the most significant - could be determined. More rotations than just three, would allow for even higher non-axi modes to be determined.
The math and the calculations are not easy, but certainly doable.
- Home
- Loudspeakers
- Multi-Way
- Acoustic Horn Design – The Easy Way (Ath4)