Maybe It did not quite turn out as intended, insofar as I wanted to change the distribution of vertical vs. horizontal walls towards increasing the area of vertical control. When I defined smaller angles than 30 degree, the results looked much the same as before. This is the definition I used:
But I think the vertical dispersion is no governed more evenly now, which is good for sound power.
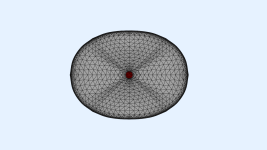
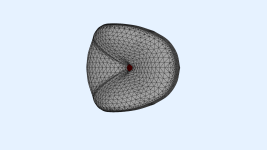
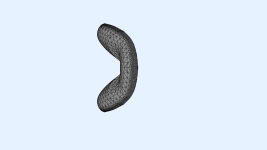
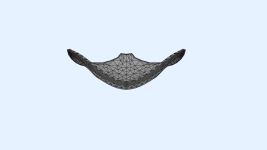
Should be good enough after some refinement of the horizontal pattern.
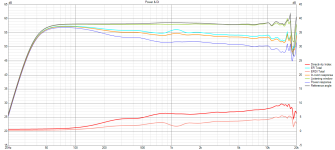
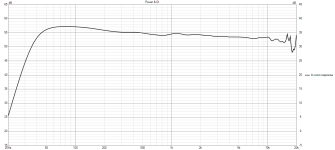
Somewhat reminiscent of the JBL 2404H ....
Code:
R-OSSE = {
  R = 160     - 40*sin(p)^2
  r0 = 9.3
  a0 = 10.85
  a = 60     -18*trwu(0.4363, 0.6, 5, p)*sin(p)
  k = 0.3     + 0.2*cos(p)^2 + 5*trwu(0.4363, 0.6, 5, p)*sin(p)
  r = 0.18     - 0.06*cos(p)^2 + 0.02*sin(p)^2
  b = 1.2     + 0.2*cos(p)^2 - 1*sin(p)^2
  m = 0.8
  q = 6 + 3*trwu(0.4363, 0.6, 5, p)*sin(p)^2
}
But I think the vertical dispersion is no governed more evenly now, which is good for sound power.


Should be good enough after some refinement of the horizontal pattern.


Somewhat reminiscent of the JBL 2404H ....
This device is only 32 cm wide, and it holds directivity way below 1 kHz on the horizontal axis. If one preferred another appearance and a crossover at 1 kHz was enough, a smaller horizontal diameter is feasible, as long as the vertical dimesion does not get reduced, then leading to a more circleish frontal appearance. My decision for the width of 32 cm was made because a somewhat rounded enclosure for a 10-inch woofer is at least 36 cm wide, and a smaller diameter would make the waveguide look silly small above the wooden box.
In any case: the principle of a very wide horizontal (in this case 130+ degree) and narrower vertical pattern for sound power optimization can come in different shapes, depending on the intended crossover frequency and size of the device. I hold my claim this is the proper approach to both consider spaciality as well as image size, both resulting from a wide horizontal pattern, while also diminishing unnecessary energy on the vertical axis, which would otherwise only negatively contribute to the total sound power radiated, resulting in a too bright presentation.
Looking forward for other designs that best mine. 😊
That's based on A460G2 (⌀460 mm), but it can be applied in the same way to any axisymmetric waveguide.@mabat: what are the dimensions of this? Looks....interesting in some way 🤣
Could you share the whole input script? Would.like to play around with that a bit.
@sheeple, I ran the sim with a bit finer mesh -


Mesh.LengthSegments = 48
Mesh.AngularSegments = 120
Mesh.SubdomainSlices =
Mesh.WallThickness = 6
Mesh.ThroatResolution = 5
Mesh.MouthResolution = 7
Mesh.RearResolution = 25
(Maybe this is unnecessarily dense, haven't tried. It's still only 2432 elements.)


Mesh.LengthSegments = 48
Mesh.AngularSegments = 120
Mesh.SubdomainSlices =
Mesh.WallThickness = 6
Mesh.ThroatResolution = 5
Mesh.MouthResolution = 7
Mesh.RearResolution = 25
(Maybe this is unnecessarily dense, haven't tried. It's still only 2432 elements.)
Last edited:
There's nothing easier than to make one and try...I hold my claim this is the proper approach to both consider spaciality as well as image size, [...]
There's nothing easier than to make one and try...
Yeah, after I find the time to ...
I ran the sim with a bit finer mesh -
... make it simulate proper. Then, I will ask a friend to make me a printable model from fusion.
Thanks for checking. I should have used the finer mesh, was kind of a quick shot. In principle it should be possible to solve the remaining issues.
What was the number of frequencies for these plots?
What was the number of frequencies for these plots?
Last edited:
Only 40.
This is a STEP + STL for a 1-inch version, if anyone had the patience to continue (I don't) - https://at-horns.eu/ext/sheeple-1inch.zip

This is a STEP + STL for a 1-inch version, if anyone had the patience to continue (I don't) - https://at-horns.eu/ext/sheeple-1inch.zip
And the full Ath script I used.
R-OSSE = {
R = 160 - 40*sin(p)^2
r0 = 9.3
a0 = 10.85
a = 60 -18*trwu(0.4363, 0.6, 5, p)*sin(p)
k = 0.3 + 0.2*cos(p)^2 + 5*trwu(0.4363, 0.6, 5, p)*sin(p)
r = 0.18 - 0.06*cos(p)^2 + 0.02*sin(p)^2
b = 1.2 + 0.2*cos(p)^2 - 1*sin(p)^2
m = 0.8
q = 6 + 3*trwu(0.4363, 0.6, 5, p)*sin(p)^2
}
Mesh.LengthSegments = 44
Mesh.AngularSegments = 120
Mesh.SubdomainSlices =
Mesh.WallThickness = 6
Mesh.ThroatResolution = 5
Mesh.MouthResolution = 8
Mesh.RearResolution = 25
ABEC.SimType = 2
ABEC.f1 = 400
ABEC.f2 = 20000
ABEC.NumFrequencies = 40
ABEC.Abscissa = 1
ABEC.MeshFrequency = 1000
ABEC.Polars:SPL_H = {
MapAngleRange = 0,180,37
NormAngle = 5
Distance = 2
}
ABEC.Polars:SPL_V = {
MapAngleRange = 0,180,37
NormAngle = 5
Distance = 2
Inclination = 90
}
ABEC.Polars:SPL_D = {
MapAngleRange = 0,180,37
NormAngle = 5
Distance = 2
Inclination = 35
}
Report = {
Title = "sheeple test"
Width = 1200
Height = 640
PolarData = SPL_H
PolarDataV = SPL_V
NormAngle = 1000
}
a = 60 - 18*trwu(0.4, 0.8, 2, p)*sin(p)

That already looks quite good and the wider transition seemingly solved many of the issues.
Beware the throat diameter is still set to a sub 1-inch 18.6 mm (minimum aparture of the DFM-2535 if used with a dedicated throat insert).
The horizontal coverage angle could be somewhat reduced again. It's now at 70 and was at 65-67 degree before. It widened from where it was at before the make over, due the changes that occured to the profile. When I was working the simulations, it sometimes felt as if creating a clean profile at 70/140 degree was pushing the limits of controllability, while 60 was much easier to attain. But I don't know if there is much improvement possible with that little more of a constraint to 65-67.
Last edited:
It's very sensitive, it's not possible to adjust the coverages just by changing the nominal values.
Anyway:
a = 58 - 17*trwu(0.4, 0.8, 2, p)*sin(p)


For a reference, someone may continue:
Anyway:
a = 58 - 17*trwu(0.4, 0.8, 2, p)*sin(p)
For a reference, someone may continue:
Code:
R-OSSE = {
  R = 160 - 40*sin(p)^2
  r0 = 9.3
  a0 = 10.85
  a = 58 - 17*trwu(0.4, 0.8, 2, p)*sin(p)
  k = 0.3 + 0.2*cos(p)^2 + 5*trwu(0.4363, 0.6, 5, p)*sin(p)
  r = 0.18 - 0.06*cos(p)^2 + 0.02*sin(p)^2
  b = 1.2 + 0.2*cos(p)^2 - sin(p)^2
  m = 0.8
  q = 6 + 3*trwu(0.4363, 0.6, 5, p)*sin(p)^2
}
Last edited:
The answer for the size was really easy, just look at the formula...I created a simple script to automate creating configs with variable parameters, running ABEC with some pixel detection, creating the reports and then moving those reports to an output folder.
I'd like to use it to simulate waveguides in an enclosure of fixed size, so the morph feature would be necessary. Is it possible to have ath return the diameter of the the waveguide if it was done in circular mode, so the script could compare that to the morph target size and omit the simulations where the difference is too big?
If you want to try my script:
-extract in the ath.exe folder
-edit the config.ini with your file paths
-run _pixelpos.py to set up the coordinates of the pixels to check for ABEC progess
-edit the base_template.txt to your liking. Use double {{}}, as single {} are for the variable parameters
-edit params.ini
-run mach_durch.py (forgot to rename that)
-report bugs to ChatGPT
It's a very simple script and does not have very good error handling, yet. But it ran on my machine for >8hours without problem.
Todo: Read the results and find a way to sort the results by smoothness of a mix of lines.
I've updated my scripts to run simulations only with waveguides that have a radius specified in the params.ini.
Now I'm trying to have them rated automatically and for that I'm missing some experience. All waveguides on at-horns seem to have an almost horizontal RE in the radiation impedance graph. Would it make sense to rate a waveguide based on slope, deviation and 'low frequency extension'? I've tried that with a few hundred simulations and it seems to work, but before I write some additional scripts to optimize the parameters a hint if that's a good idea would be nice.
Hi,
it depends what you want from your waveguide. You might want to increase "loading", which inevitably makes wavy impedance graph for example and now you'd optimize for something else than flat impedance plot. I've been automating just for about a week now and do it the following way:
I find ~good profile by hand. When I find it I have a script that does permutations for parameters I want to further refine it, and runs abec for each and collects the result images, which I then inspect by myself. I pick up the best and some possible other good ones and run another script which makes new permutations to run through based on parameters the good ones had, gradually zoning in. This of course usually turns as a dead end, meaning that the curve is just wrong and can't be optimized as far as I'd like to without changing something quite dramatically, so more intelligence within the automation process would be cool. You could collect all data you produce with this, and try and train some predictive AI model with it. I don't know how much data is required though, although an automatic script can do few thousand a day on my quite old computer.
My process is collection of manual and automatic work. It is three scripts currently, one for making the permutations, one for running abec automatically and collecting the data, then third script to fetch parameters for next run based what I told were the good ones. I save the permutations into a CSV file so I can just look myself what parmeters morph the response to direction I want it to, also the script that analyzes the data has easier time with CSV than looking all the definition files. This saves already tons of time, and the most difficult part from the automation is still handled by me, the operator watching it over supposedly knowing better what's good and what's not 😀 Next upgrade would be to define the automatic ranking, but I'm afraid of it getting quite complex since I would have to somehow describe to the computer what I want to optimize for, but I haven't yet tried that yet so might not be that hard after all 🙂 I can get very good profiles manually with just few tries, but to optimize the ripple out might take few hundred permutations on top, so don't dream making very good graphs just by hand. My experience on this sorta thing is very limited as of now, taking babysteps, so hopefully others provide more to this subject.
ps.
All these were relatively easy to accomplish with ChatGPT with very limited prior knowledge on Python programming. I do programming for living so I'm relatively comfortable with this stuff though. I made the script to make a simple browser based UI that opens up after a run for easy comparison of the images as well to stream line all clicking around from the process, but his has some quirks still. Anyway, fun time with a hobby 🙂 I did not use any pixel sniffing, just some simple functions to detect active window, keypress functions to trigger solving and spectra and related popups with some wait times, and some timers and logic to navigate through possible error situations if something is not finished before a timer runs out. This is not the fastest way, as there is some seconds wasted waiting, but seems quite robust with active window checking. I can halt the process by activating some other window, like if I want to eyeball the results so far I can just go and do that and the process will wait until the script window or abec window becomes active again.
Last edited:
- Home
- Loudspeakers
- Multi-Way
- Acoustic Horn Design – The Easy Way (Ath4)