Why is the rise time of the sq wave faster on the leading edge during the rising sine wave (+) side and opposite on the down ward slope of the sine wave? Then it is slower on the leading edge during the falling of the sine wave (going neg - towards zero)?
Some of the square waves indicates maybe some slew limiting going on.... ? Can you test for the amps slew rate limites under loads??
THx-RNMarsh
All tests including the overload tests and overload details where made with load 8R in series with output inductor 0.8µH || 10R. Zobel 100n/10R has been removed.
To which picture do you refer?
IMD measurements part 1
Today I have generated a new csv file for my arbitrary generator:
18.5/19.5kHz imd test. (If you are owner of HMF2525 or similar device see attached file "sinus_imd_test_2ms.zip")
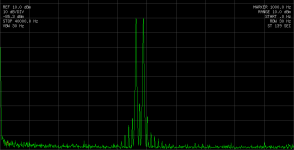
Measured SA2013 using TMC 56p/680p/470R @ 8R resistive load @ 80V pk2pk.
For reference I have added a sweep of the arbitrary generators output terminated with 75R using HP3585A.
Attached pictures:
Today I have generated a new csv file for my arbitrary generator:
18.5/19.5kHz imd test. (If you are owner of HMF2525 or similar device see attached file "sinus_imd_test_2ms.zip")
Measured SA2013 using TMC 56p/680p/470R @ 8R resistive load @ 80V pk2pk.
For reference I have added a sweep of the arbitrary generators output terminated with 75R using HP3585A.
Attached pictures:
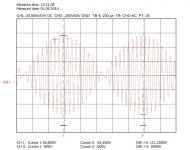
- reference HMF2525 output 2700mv peak terminated at HP3585A using 75R input.
- SA3013 80Vpk2pk @ 8R resistive load
- osci screenshot
Attachments


IMD measurements part 2
pictures:

... or is the imd figure simply too bad so it would be better to avoid building an amplifier using this circuit?😱
pictures:
- reference HMF2525 output 2700mv peak terminated at HP3585A using 75R input.
- SA3013 112Vpk2pk @ 8R resistive load
- SA3013 112Vpk2pk @ 8R resistive load repeated
- osci screenshot
... or is the imd figure simply too bad so it would be better to avoid building an amplifier using this circuit?😱
Attachments
... maybe an expert can help here to calculate imd values as I do not have the math knowledge...
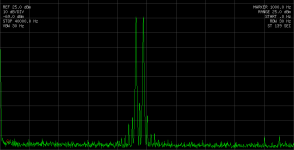
For a 19 kHz + 20 kHz two-tone IMD test, the "IMD value" is defined as the ratio of the amplitude of the 1 kHz tone to the amplitude of the high-frequency tones.
Taking image 2 from your post #842 as an example, it looks like the 1 kHz tone is about 95 dB down from the amplitude of the two high-frequency tones, expressed as a percentage this is about 0.0018%.
A couple of good references for audio measurements and definitions are:
Audio Measurement Handbook, available here:
AP High Performance Audio Analyzer & Audio Test Instruments : Home
and "Audio Specifications" from Rane Audio, available here:
http://www.rane.com/pdf/ranenotes/Audio_Specifications.pdf
...
Taking image 2 from your post #842 as an example, it looks like the 1 kHz tone is about 95 dB down from the amplitude of the two high-frequency tones, expressed as a percentage this is about 0.0018%.
...
Think it's about 85 db difference. But the reference is also about 85 to 86 db. Clearly my measurement limits here. So I can only say imd is better as 85 db?
...
AP High Performance Audio Analyzer & Audio Test Instruments : Home
and "Audio Specifications" from Rane Audio, available here:
http://www.rane.com/pdf/ranenotes/Audio_Specifications.pdf
...
Thx so much! "rane" document is really good. 🙂
Unfortunately "AP" needs an account to download it ...
Think it's about 85 db difference. But the reference is also about 85 to 86 db. Clearly my measurement limits here. So I can only say imd is better as 85 db?
Doh! So it is. Obviously couldn't count this morning!
Thx so much! "rane" document is really good. 🙂
Unfortunately "AP" needs an account to download it ...
You're welcome. I must be "logged-in" at AP without realising. You can register for an account for free (click "Create an Account" in the vertical list to the left).
... and the imd simulation for 112V pk2pk ...
Very excellent measurements in every aspect of your project.
This give poor ol' me (lacking $$ for this equipment) , a "ballpark"
metric to estimate my two similar amps (the "badger" and "wolverine".)
Yours is quite similar. I still like this topology even as I have (am) riding
the "CFA train" at the moment.
It gives very consistent performance even as some on the forum
derate it for "sterility" or "non-engaging".
A bunch of blowhard's 😀 ....
PS - I have mentioned your project as an example of "real world VS.
simulation (and as a layout example).
OS
Very excellent measurements in every aspect of your project.
...
Thank you for your kind words!
Of course money makes it easier getting higher quality test equipment. 😉
I've started with a good soundcard and ARTA which is more as enough for the most diy audio projects. Wanted to learn building a high performance amplifier from scratch using simulation software, building it and learn how to measure it, hear and feel the performance.
Many people have added their contributions to this thread - thank you all helping me to get it right.
Your hard work on the CFA train is also very impressive and one of my next projects will be a CFA - maybe one of yours? It would be fine if you could add an updated index in your first post of your thread to get an overview of the different projects...
BR, Toni
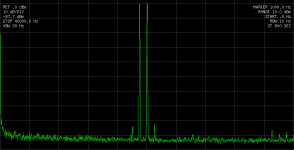
Redone: IMD measurements using 19/20kHz
as you clearly have seen (but not reported) the imd 18.5/19.5kHz input/output graphics have had a -60db 19kHz artefact. This was caused by a firmware error during import of the csv values. The firmware has been correct by hameg a view days ago and after upgrade the input/output pictures now look as it should:
SA2013 adds virtually no extra imd in comparison to the input.😉
A reference test using an Asus Xonar D1 and ARTA
as you clearly have seen (but not reported) the imd 18.5/19.5kHz input/output graphics have had a -60db 19kHz artefact. This was caused by a firmware error during import of the csv values. The firmware has been correct by hameg a view days ago and after upgrade the input/output pictures now look as it should:
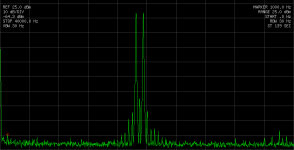
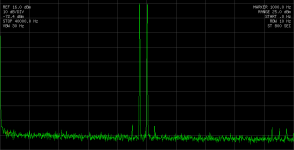
- reference HMF2525 output 2700mv peak terminated at HP3585A using 75R input
- SA3013 80Vpk2pk @ 8R resistive load (~ 100W)
- osci screenshot
SA2013 adds virtually no extra imd in comparison to the input.😉
A reference test using an Asus Xonar D1 and ARTA
- HMF2525 2700mv output/2k imd: -91,45 db
- SA3013 80Vpk2pk imd: -90 db
Attachments
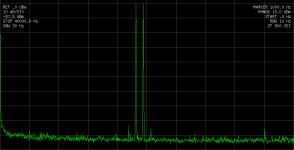
Redone: IMD measurements using 19/20kHz part 2
... and here are the 18.5/19.5 kHz tests redone:
Have fun!
Br, Toni
... and here are the 18.5/19.5 kHz tests redone:
- reference HMF2525 output 2700mv peak terminated at HP3585A using 75R input
- SA3013 80Vpk2pk @ 8R resistive load (~ 100W)
- osci screenshot
Have fun!
Br, Toni
Attachments
Last edited:
Noise ...
Output noise levels with input shorted via VP7723D:
20 µV - A-weighted
44µV - BW 20kHz
58µV - BW 80kHz
117µV - Full bandwidth
Output noise levels in reference to 200W@8R output level:
> 125 db - A-weighted
> 118 db - BW 20kHz
> 116 db - BW 80kHz
> 110 db - Full bandwidth
Output noise levels with input shorted via VP7723D:
20 µV - A-weighted
44µV - BW 20kHz
58µV - BW 80kHz
117µV - Full bandwidth
Output noise levels in reference to 200W@8R output level:
> 125 db - A-weighted
> 118 db - BW 20kHz
> 116 db - BW 80kHz
> 110 db - Full bandwidth
Toni, you might try using 2 separate oscillators for CCIR IMD and mix passively with 2 resistor at the input of the amp.as you clearly have seen (but not reported) the imd 18.5/19.5kHz input/output graphics have had a -60db 19kHz artefact. This was caused by a firmware error during import of the csv values. The firmware has been correct by hameg a view days ago and after upgrade the input/output pictures now look as it should:
The HMF2525 and the output of SA2013 have nearly the same -88db 1kHz referenced to the level of 19/20kHz.
- reference HMF2525 output 2700mv peak terminated at HP3585A using 75R input
- SA3013 80Vpk2pk @ 8R resistive load (~ 100W)
- osci screenshot
SA2013 adds virtually no extra imd in comparison to the input.😉
A reference test using an Asus Xonar D1 and ARTA
These are my measurement limits as the input signal isn't good enough.
- HMF2525 2700mv output/2k imd: -91,45 db
- SA3013 80Vpk2pk imd: -90 db
This will have no IMD if you use resistors hand made by virgins from Unobtainium. 😉
This was in fact how the early CCIR IMD tests were done and indeed one reason for doing the original tests cos it didn't need supa dupa oscillators if you look only at 1kHz.
Toni, you might try using 2 separate oscillators for CCIR IMD and mix passively with 2 resistor at the input of the amp.
...
Thx! This is definitely worth a try! Hopefully my sinus generators have enough SNR ratio ...
BR, Toni
Thx! This is definitely worth a try! Hopefully my sinus generators have enough SNR ratio ...
You could pass the tones through a couple of high-order high-pass filters built with LME49990 before mixing them together.
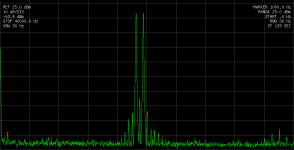
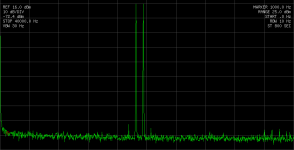
CCIF IMD 0.0013% @200W@8R
... passively mixing the two sinus generators by resistors (2 x 560R / 2.5k input impedance): too high noise. The IMD results where completely masked by the higher noise level and/or interaction between the generators output stages.
Filter buffers may help here indeed to decouple the 2 sinus signals and mix them... (but was to lazy to try this method) 😉
Again measured the IMD using ARTA and my Asus Xonar D1 but let the xonar generate the two tone sinus (which I haven't tried before cause thought I need high resolution dithered sinus curves).
- 200W@8R: CCIF IMD 98 db / 0.0013%
- 100W@8R: CCIF IMD 100db / 0.001%
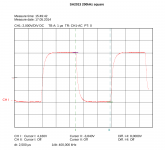
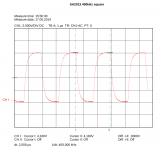
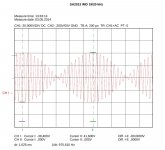
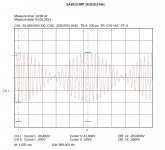
Small signal square wave tests OR why a zobel is always needed
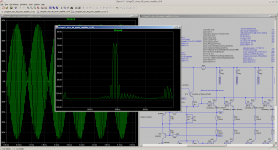
During small signal measurements without zobel I saw an interesting osci screenshot and now I know why:
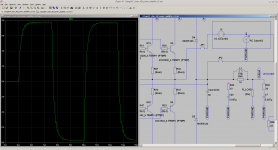
Again simulated my amplifier in LTSpice with removed Zobel and added 8nF parasitic capacitance on output before inductor: the attached ltspice screenshot exactly represents real life seen on hameg osci screen ... 😉
... took my Peaktech 2165, set it to capacitance measurement using 1kHz test signal, removed input/vas stage and all cables from ampifier and measured between output and ground: 8,4nF 😛
Maybe this measurement method is not ok and the value is per accident the same as the simulation ...
The oscillation frequency of the seen "wiggles" in real life (~ 9 MHz) is nearly the simulated one (~ 8.5 MHz)
8nF parasitic capacitance seems to be normal for those many output BJT's mounted on a big heatsink with doublesided pcb using a groundplane
Need always to be inserted in the simulation schematic to be more realistic?
What do you think?
During small signal measurements without zobel I saw an interesting osci screenshot and now I know why:
Again simulated my amplifier in LTSpice with removed Zobel and added 8nF parasitic capacitance on output before inductor: the attached ltspice screenshot exactly represents real life seen on hameg osci screen ... 😉
... took my Peaktech 2165, set it to capacitance measurement using 1kHz test signal, removed input/vas stage and all cables from ampifier and measured between output and ground: 8,4nF 😛
Maybe this measurement method is not ok and the value is per accident the same as the simulation ...
The oscillation frequency of the seen "wiggles" in real life (~ 9 MHz) is nearly the simulated one (~ 8.5 MHz)
8nF parasitic capacitance seems to be normal for those many output BJT's mounted on a big heatsink with doublesided pcb using a groundplane
Need always to be inserted in the simulation schematic to be more realistic?
What do you think?
Attachments
- Home
- Amplifiers
- Solid State
- 2stageEF high performance class AB power amp / 200W8R / 400W4R