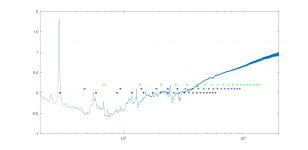
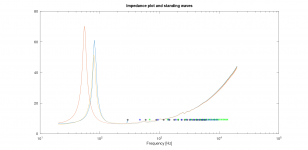
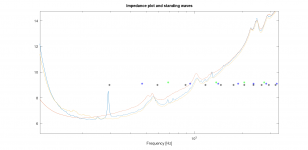
Keep this simple, don't add resistance as this just tends to add noise which is much of what you see in the difference graph.This is the difference between in and outside of the enclosure. I did match them globally by adding a constant resistance to one of the two measurements.
Compare the individual graphs side by side. The blips that represent resonances are easy enough to see. Anything that appears in the cabinet version that is not in the free air plot came from the cabinet somehow. You can then use that as a way to gauge the effectiveness of any damping. You can compare the shape of the main impedance peak. As damping is added the peak will become lower and more spread out from the lower Q of the main resonance. Just be sure not to add too much which is easy enough to see as the shape of peak starts to become deformed.
It was virtual resistance 🙂 Only to get the difference around zero, which doesn't change a thing anyway.Keep this simple, don't add resistance as this just tends to add noise which is much of what you see in the difference graph.
Compare the individual graphs side by side. The blips that represent resonances are easy enough to see. Anything that appears in the cabinet version that is not in the free air plot came from the cabinet somehow
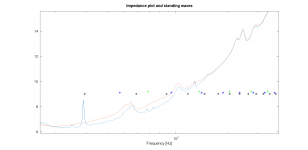
That is closer to what I meant. The graph scaling is unusual and there is no peak in the red graph.
^ I think its missing the system resonance part, graph starts above 100Hz.
^^ So first mode of longest dimension making strongest blip. Its also last to go when adding damping material inside, requires most damping as its longer wavelength than the others. Lowest mode(s) also fall into pass band if any so that's your main enemy, the peak just below 300Hz. If you make that go away with damping you can be quite sure every other blip related to modes have been minimized as well.
If its tough to get it out with damping there is one solution that prevents it happening altogether: relocate the driver to center of the dimension and it should vanish just like that 🙂 Another one is to make it a three way box and push them all blips out of band. 3-way, driver on the center, some damping, no problems. As its two way you need to put some work into it as all of it is on the pass band. Although, good enough is usually fine, perhaps none of it is audible in the first place.
Last edited:
That is a much better view and helps to put perspective on the size of the resonances. The first black and green stars are the only real ones to worry about. The longest length can be tackled by putting absorbent at the halfway point on a brace in the cabinet. Some on the walls too should get most of the wiggles away.
Is this box braced or unbraced?
Is this box braced or unbraced?
Unbraced, undamped, un-everythingIs this box braced or unbraced?
Many of the little wiggles higher in frequency could well go away with a brace or two.Unbraced, undamped, un-everything
I measured the woofer with the microphone very close to the cone as explained in https://www.audiosciencereview.com/...ents-spinoramas-with-rew-and-vituixcad.21860/
This is the result:
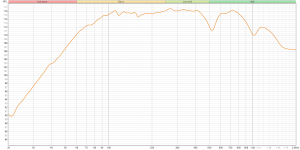
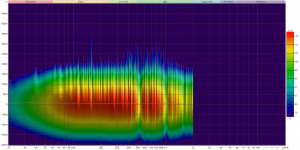
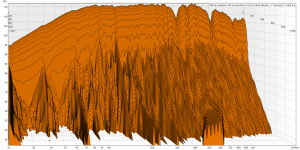
Low frequency roll-off is as expected (VituixCAD). The dips around 500Hz and 1000Hz I can't explain. Any ideas? And what can I do about it?
Then the waterfal and spectrogram: I know what they mean in a mathematical sense, but don't know if they are good or bad, what causes certain features nor what to do about any bad signs.
Any clues?
This is the result:


Low frequency roll-off is as expected (VituixCAD). The dips around 500Hz and 1000Hz I can't explain. Any ideas? And what can I do about it?
Then the waterfal and spectrogram: I know what they mean in a mathematical sense, but don't know if they are good or bad, what causes certain features nor what to do about any bad signs.
Any clues?
Those seem to coincide with impedance plot humps, which is convenient. Would another frequency response dip appear around ~300Hz if you were to remove the blanket inside? How is the blanket positioned inside by the way? Since it was effective for lowest mode inside the box it ought to have reduced all higher modes as well. For this reason perhaps the 500Hz and 1000Hz humps aren't modes inside the box but something else.
Perhaps they are cone resonances? I believe surround resonance is first to appear (I really have no knowledge, just faint memory from some forum posts) where cone surround is decoupled from what the voice coil does, moves in opposite phase and then there is dip as the Sd was now reduced and even works against the rest.
On the other hand it might be just artifact from the measurement, path length from cone edge to middle (for 15" driver) is roughly half wavelength of ~1kHz so that could be it. Did you measure far field? I suspect at least the 1kHz dip goes away little bit further away.
If these are cone resonances, then there is hardly anything you can do other than change driver. Which driver it is by the way?
It’s a close range measurement, so likely you’re seeing standing waves in the enclosure. Cone breakup normally will show a rising pattern with rising frequency and surround problems don’t show up that easily on close range. It’s not bad btw. But you’d have to investigate that 500Hz dip. Is there a corresponding dimension internally?
The ~500Hz impedance peak and frequency response dip seem to be at a different frequency; nearby, but not equal.
The blanket is positioned with the blue side up ;-) I just put it in in such a way that it makes a kind of bridge in order to get the blanket material away from the bottom in an attempt to get it where the air is actually moving.
Clearest indication that it is not a mode is that the bumps are already present in the impedance measurement of a free standing woofer. The plots from Faital Pro do not show them though. The woofer is a Faital Pro 12PR320.
REW is actting weird, so I can't test your path length hypothesis.
Attachments
I don't think so. Impedance plots with standing waves indicated with * are a few posts above.It’s a close range measurement, so likely you’re seeing standing waves in the enclosure. Cone breakup normally will show a rising pattern with rising frequency and surround problems don’t show up that easily on close range. It’s not bad btw. But you’d have to investigate that 500Hz dip. Is there a corresponding dimension internally?
Tom, nearfield measurements are only usable up until just before the first dip. The nulls at regular intervals are an effect of the nearfield technique. The nearfield needs to be spliced or merged with a far field measurement to create a composite. You also need to compensate for the baffle diffraction which is absent in the nearfield measurement.
Have a read of Keele's original paper and Arta's AN4
https://www.pearl-hifi.com/06_Lit_A...apers/Keele_D_B/LF_Near-field_Measurement.pdf
https://artalabs.hr/AppNotes/AN4-FreeField-Rev03eng.pdf
Have a read of Keele's original paper and Arta's AN4
https://www.pearl-hifi.com/06_Lit_A...apers/Keele_D_B/LF_Near-field_Measurement.pdf
https://artalabs.hr/AppNotes/AN4-FreeField-Rev03eng.pdf
I tried to calculate what is happening. For low frequencies the phase of sound coming from all places of the cone is roughly the same. You get constructive interference and maximum signal. As the frequency increases the phase differences increase and the edge of the cone is contributing less and less and even starts to interfere destructively/ At even higher frequencies you end up with a contribution of the woofer (area) like this:
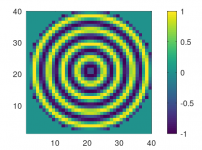
A lot of rings that for higher and higher frequencies average out more and more.
For the total output at the microphone 1cm away from the cone as a function of frequency, I get this:
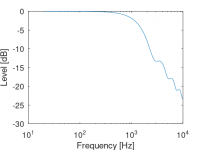
This does not agree with the measurement. Initial reaction is to deny reality, but I'm old enough to realise that I might have made an error. But when I look at the image in the Keele document, it says that the first minimum is at a/lambda = 1. As 'a' is the radius, that would mean 343/0.12 = 2850Hz. That value is very close to my first minimum.
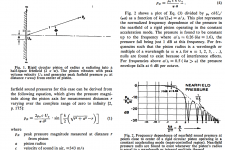
What am I doing wrong systematically?

A lot of rings that for higher and higher frequencies average out more and more.
For the total output at the microphone 1cm away from the cone as a function of frequency, I get this:

This does not agree with the measurement. Initial reaction is to deny reality, but I'm old enough to realise that I might have made an error. But when I look at the image in the Keele document, it says that the first minimum is at a/lambda = 1. As 'a' is the radius, that would mean 343/0.12 = 2850Hz. That value is very close to my first minimum.

What am I doing wrong systematically?
Well, a cone isn’t a true piston. Even in metal cones, the speed of sound in the material will have influence on the radiation.
Arta does get close to 500-600Hz:

Formula gives (343/(4x0.15=) 570Hz.
Ps. I made an error in the radius in the post above.
Formula gives (343/(4x0.15=) 570Hz.
Ps. I made an error in the radius in the post above.
- Home
- Loudspeakers
- Multi-Way
- Efficient 2-way
