... but it doesn't explain the peak at ~1000Hz. And I also don't see why the formula shown should have minima at the frequencies indicated.
I know how you feel. It's nuts. I calculated the frequencies of the throughs many times and they were never where I measured them. I decided that I had no other possibility than to not use the measurement above 400 Hz at all. Simply forgetting what I saw there. Which is particularly inconvenient as the gated farfield measurement at this frequency is mostly a random sine between two too few data points. The biggest source of my issues with trusting my speaker has always been 500 Hz to 1 kHz.
On another note: I once read the peak that shows in near-field around 1k could be a diffraction related hump. Can you see it in farfield measurements?
On another note: I once read the peak that shows in near-field around 1k could be a diffraction related hump. Can you see it in farfield measurements?
😀 I imagined it explains the ~1000Hz dip and ~500Hz is something else. Mic at center, abd that there would be dip when sound from edge hits the mic 15cm later the center is already going half cycle, opposite phase and destructive interference happens.
In addition to interference a dip could happen if Sd got smaller, or less power was delivered due to impedance blip, opposing current, back EMF stuff. Well, just guessing.
Did you do measurement further away, say at 50cm? This might take the dips out. If not, what if you add small resistor in series while measuring, say ten ohms. If its something due to impedance blip it should be gone with series resistor, shouldn't it? current drive stuff
There can be many things that cause reality and theory to be a little different but the basic principle that periodic nulls occur due to the technique is true. Fortunately the best range to blend is usually away from the nulls.
A good document that shows the range of uncertainty in most short gated measurements.
https://www.admess.de/tl_files/admess-2013/pdf/Audio Precision/AppNote - Loudspeaker EA Measurements-1.pdf
A good document that shows the range of uncertainty in most short gated measurements.
https://www.admess.de/tl_files/admess-2013/pdf/Audio Precision/AppNote - Loudspeaker EA Measurements-1.pdf
Here are some results with the microphone at changing distance and one with the speaker elevated to check whether a floor reflection is the cause.
The frequency of the dips doesn't change much. That rules out the ground reflection and according to my own calculations/simulations also the effect suggested by fluid.
Measurements:

Simulation:

The frequency of the dips doesn't change much. That rules out the ground reflection and according to my own calculations/simulations also the effect suggested by fluid.
Measurements:
Simulation:
It is clear to me that the dips are the nearfield phenomena, as you increase distance away from the woofer they lessen. By the time you are at 1m plus they will be gone. Merge the closest nearfield measurement with a far field one between 200 and 400 Hz where the curves intersect the best. Vituix does a good job of this.
If p=0 we obviously have a minimum. And the sin function has nulls at ka/2 = (2n+1).π/2 with n any natural number, resulting in p=0. It maxes out at ka/2 = (n+1).π. So p = 2.⍴0.⍵.a.v/k.a gives peaks at every f = (n+1).c/4.a. But you had figured that out I guess?... but it doesn't explain the peak at ~1000Hz. And I also don't see why the formula shown should have minima at the frequencies indicated.
If p=0 we obviously have a minimum
I'm having difficulties with the |pn|; I don't understand the absolute sign, not on that side of the =.
Let's assume that it is supposed to be on the other side. Then I agree with you on that point (only...).
And the sin function has nulls at ka/2 = (2n+1).π/2 with n any natural number, resulting in p=0.
Then we have a minimum p=0 at sin(ka/2)=0. The sine function has zeros at ka/2 = n*pi with n being any (positive) integer (including 0) .
It maxes out at ka/2 = (n+1).π.
It maxes out at ka/2=(2n+1)*pi/2 with n being any (positive) integer.
ka/2 = n*pi, so f = n*c/(2*a). That results in 343/(2*0.15) = 1143 HzSo p = 2.⍴0.⍵.a.v/k.a gives peaks at every f = (n+1).c/4.a.
The Application Note says dips at (2n+1)c/4a, which is:
(2*0+1)*c/4a = 572Hz
(2*1+1)*c/4a = 1715Hz
Note that it does not predict a null at 1000-1100Hz at all.
The formula likely has some flaws. Agree on the |p|, a pressure will hardly get negative, so using een absolute waarde (I’m too lazy to look up the proper English term) seems useless to me.
an absolute value ;-)
I made an error in my derivation also; I dropped a 2.
My new formula of the moment is:
f = nc/a = 2287Hz (for n=1)
I made an error in my derivation also; I dropped a 2.
My new formula of the moment is:
f = nc/a = 2287Hz (for n=1)
I reached the same derivation independently. No rocket science 😀. But I wonder if the formula is correct with a = radius of the piston.
If you imagine that the pathway difference between piston center and rim has to be equal to any n.λ/4 (with n>0) to get cancellation at the center, then 571Hz, 1.143Hz, 1.715Hz and so on should give the dips. We of course leave all contribution to the sound pressure in-between the center and the rim out of the question. I'd expect a square term somewhere, since the radiating area grows quadratic with the growing distance from the center. But then again, the growing distance to the mike (point sources) would lead to less contribution, those cancel out likely.
All in all the explanation of the 'peaks' in-between seems logical to me: at a certain f, you'll notice pressure cancellation of two points at 0 and λ/4 on the piston, completed by the addition of pressure of a third point further in the direction of the rim, at λ/2. And so on, just like your sim above.
Quick update:
Second waveguide with rounded mouth edge on its way:

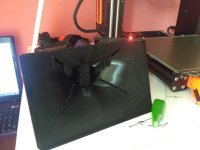
New printer (Elegoo Neptune 3 Pro iso 2S) and waveguide created from AFP file by my Fusion 360 script.
Throat had a slicing issue (which has been solved in the mean time); that's why I had to sand it.
Second waveguide with rounded mouth edge on its way:
New printer (Elegoo Neptune 3 Pro iso 2S) and waveguide created from AFP file by my Fusion 360 script.
Throat had a slicing issue (which has been solved in the mean time); that's why I had to sand it.

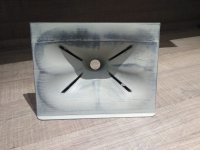
Enclosure V2 on its way:

Bracing (partly?) done, damping foreseen and double baffle planned.
Bracing (partly?) done, damping foreseen and double baffle planned.
In an attempt to highlight any impedance anomalies I tried to model impedance of the speaker (in a closed box). The plan was to fit that model to the measurement and than subtract it from the measurement.
Unfortunately the fitting does not work well. The model seems off.
Model:

Fit:

Fit was limited to impedance peak.

Full frequency fit.
But the shape of the impedance plot in vituixcad does match my model:

What is going on here?
Unfortunately the fitting does not work well. The model seems off.
Model:
Fit:
Fit was limited to impedance peak.
Full frequency fit.
But the shape of the impedance plot in vituixcad does match my model:
What is going on here?
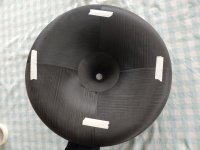
Printing is ready. Everything seems to fit really well (with a little persuasion). The first waveguide had some gaps between parts, but it somehow is much better this time. I think I'm going to use instant glue iso some slower gap filling glue.


I can handle the waveguide with just the four pieces of sticky tape.
I can handle the waveguide with just the four pieces of sticky tape.
Attachments
These look really good to me albeit through 67 year old eyes. Curious though how critical it is for the pices to fit perfectly?
This is one of those threads I need to read again
This is one of those threads I need to read again
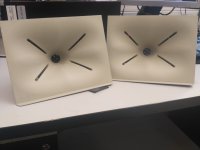
Revel Plasto and some sanding can do this (printed raw vs. putty and sanded). Cheaper alternative is acrylic wood putty.
The print failed near completion, so the guy, who was printing it, printed the top part separately and glued it.
And a cool trick to get a nice surface is to use photoresin, I just brushed it on, let sit for a while and then harden with UV light.
The print failed near completion, so the guy, who was printing it, printed the top part separately and glued it.
And a cool trick to get a nice surface is to use photoresin, I just brushed it on, let sit for a while and then harden with UV light.
Attachments
It's a journey 🙂This is one of those threads I need to read again
- Home
- Loudspeakers
- Multi-Way
- Efficient 2-way