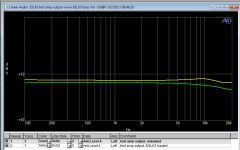
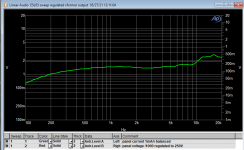
@Hans: I did a quick check on the test amp, looking at it's output response while loaded with the ESL63.
So the effect you mentioned (dropping drive voltage at high frequency) is there, but it is much less in magnitude than what I see at the secondary of the xformer. Interestingly, with load, the amp output is about 0.1dB higher in the lower band, 0.2dB at higher freqs. Weird.
Jan
So the effect you mentioned (dropping drive voltage at high frequency) is there, but it is much less in magnitude than what I see at the secondary of the xformer. Interestingly, with load, the amp output is about 0.1dB higher in the lower band, 0.2dB at higher freqs. Weird.
Jan
Attachments
Last edited:
@Hans Polak,
If you incorporate this stray coupling into your model, the minor midrange hump in your modeled response shown in Post #265 should flatten out to match measurement even better.
Hi Steve,
Again a great contribution and of course a thing to add directly into the model.
Hans
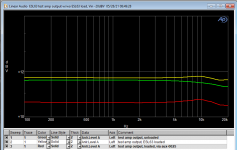
Small addition: I realized that the power amp being class D might upset the AP, so I ran it again through AP's purpose-designed AUX-0025 class D measurement filter.
It does change the level by about a dB, but not the response shape.
Jan
It does change the level by about a dB, but not the response shape.
Jan
Attachments
@Hans: I did a quick check on the test amp, looking at it's output response while loaded with the ESL63.
So the effect you mentioned (dropping drive voltage at high frequency) is there, but it is much less in magnitude than what I see at the secondary of the xformer. Interestingly, with load, the amp output is about 0.1dB higher in the lower band, 0.2dB at higher freqs. Weird.
Jan
Hi Jan,
Well, when it's not the amp, there must be another reason for the 19dB drop at 20Khz.
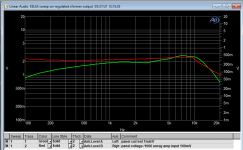
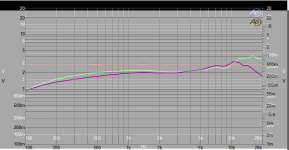
The 1Meg load places a significant load on your secondary as can be seen in your first and second recording below.
With 1M load, current drops 12dB from 2.8m@8Khz to 0.7m@20Khz, while without this load current drops 3.8dB from 2.8m@8Khz to 1.8m@20Khz.
So when you tried to regulate the secondary voltage to a constant level by measuring at your 1Meg/1K divider in the third image, you get wrong results of ca 12dB-3.8dB= 8.2dB@20Khz changing your current curve quite a bit.
When projecting the recording without 1Meg on top of the recording with a "constant" 250Volt, correcting the just calculated 8.2dB error will change the the currents at 20Khz to land exactly on top of each other.
Hans
.
Attachments
@Hans: will you post the upgraded model here? Please ;-)
Jan
Yes of course, we all want to have a model that is as accurate as possible.
Hans
I seem to recall either Baxandall or Walker making mention of the coupling as have a smoothing effect.
ref Baxandall, chapter 3 p 192, Loudspeaker and Headphone Handbook, editor Borewick.
IMHO a must read if you try to understand Quads electrostats. I seem to remember there was a pdf that could be downloaded, but I have the book...
/örjan
Hi Jan,
Well, when it's not the amp, there must be another reason for the 19dB drop at 20Khz.
The 1Meg load places a significant load on your secondary as can be seen in your first and second recording below.
With 1M load, current drops 12dB from 2.8m@8Khz to 0.7m@20Khz, while without this load current drops 3.8dB from 2.8m@8Khz to 1.8m@20Khz.
So when you tried to regulate the secondary voltage to a constant level by measuring at your 1Meg/1K divider in the third image, you get wrong results of ca 12dB-3.8dB= 8.2dB@20Khz changing your current curve quite a bit.
When projecting the recording without 1Meg on top of the recording with a "constant" 250Volt, correcting the just calculated 8.2dB error will change the the currents at 20Khz to land exactly on top of each other.
Hans
.
Hans, I understand what you are saying, but you assume that the secondary voltage remains the same with or without the 1M/1k divider. That I do not know, especially not at the high frequencies.
Also, I agree that the 20kHz currents become the same in magnitude, the curve is still quite different I think.
BTW I looked at electrostatic high voltage meters but the cheapest I found was € 5k ...
Jan
Last edited:
Jan,
What I was trying to say is that when trying to regulate a secondary voltage while measuring 250mV at the 1K voltage divider, the load caused by the 1Meg resistor does introduce a huge error, not resulting in 250Volt@20Khz but a 8.2dB larger value at 20Khz.
Hans
What I was trying to say is that when trying to regulate a secondary voltage while measuring 250mV at the 1K voltage divider, the load caused by the 1Meg resistor does introduce a huge error, not resulting in 250Volt@20Khz but a 8.2dB larger value at 20Khz.
Hans
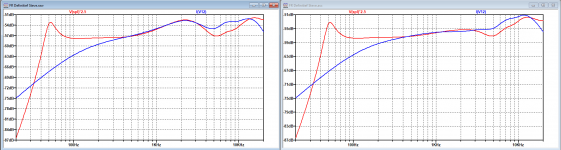
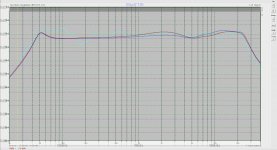
Here is the version when cross-coupling the inductors with K=0.3 for the adjacent and K=0.1 for those one place further.
I didn't have the time to further experiment with these two factors, but the model is attached for further experimenting.
The first image shows at the left resp. in blue the transformer current and in red the SPL output in front of the speaker without these inductor couplings, and at the right with the mentioned couplings.
It has definitely a positive effect on the FR between 5Khz & 8Khz.
Hans
.
Attachments

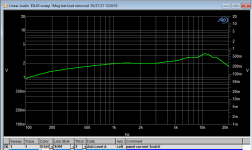
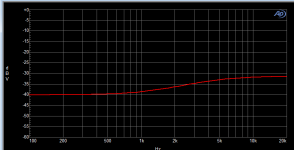
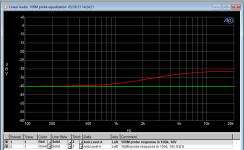
I tried another way to measure the high voltage. Connected a 1:100 probe, 100Mohm, to the AP input set to 100k (cannot be higher). Input is 20dBV.
At low frequencies it is very accurate at 60dB attenuation, but increases at higher frequencies. I will have to learn how to turn this into an EQ file and apply it to the measurements to correct them.
And so it goes ;-) .
Jan
At low frequencies it is very accurate at 60dB attenuation, but increases at higher frequencies. I will have to learn how to turn this into an EQ file and apply it to the measurements to correct them.
And so it goes ;-) .
Jan
Attachments
Jan,
Since 1Meg/1K is clearly loading the secondary voltage too much, you could also try 100Meg/10K.
You won’t get the same 250mV but 25mV instead, which should be still measurable with your AP.
Hans
Since 1Meg/1K is clearly loading the secondary voltage too much, you could also try 100Meg/10K.
You won’t get the same 250mV but 25mV instead, which should be still measurable with your AP.
Hans
No, I want to measure directly at the top of the xformer with the 100M probe into the 100k of the AP. See my last post above. That should do it.
I only have to figure out how to apply the EQ correction. All software ;-)
Jan
I only have to figure out how to apply the EQ correction. All software ;-)
Jan
Impedance ratio of the transformer is approx 1:120 and considering 12 ohms at high frequency.
That gives an impedance of 170k ohms. So yes... 1 Meg is close, I guess 10 Meg would be ok enough! I use a Tektronix P1650A with 100M ohm.
That gives an impedance of 170k ohms. So yes... 1 Meg is close, I guess 10 Meg would be ok enough! I use a Tektronix P1650A with 100M ohm.
Impedance ratio of the transformer is approx 1:120
Wasn't the voltage ratio 1:120?
Jan
Yes, voltage ratio is 120 and impedance ratio (120)^2.
@Jan, great to see you got the AP probe working.
Hans
@Jan, great to see you got the AP probe working.
Hans
Steve,
Thanks for your explanation.
The deeper you dive in the ESL63 details, the greater the mystery how they got things done in those days.
What a fantastic achievement.
Hans
Jan, I assume you are going to direct drive the speaker from the point where the transformers connect to the delay line, do you know the approximate voltage required for full output and are you going to incorporate the ionization detection that Quad used to trigger the crowbar
Stuart
- Home
- Loudspeakers
- Planars & Exotics
- QUAD 63 (and later) Delay Line Inductors