OK, but this is still a reasonable confirmation that we're on the right path.
Thanks for this Hans.
One thing I have been thinking about is internal leakage currents in the transformers, but I don't really have an idea how that would look like.
And I still wonder why that 2.2kHz hump comes from.
Edit: I guess we use the same spice model for the panel ;-)
Jan
Thanks for this Hans.
One thing I have been thinking about is internal leakage currents in the transformers, but I don't really have an idea how that would look like.
And I still wonder why that 2.2kHz hump comes from.
Edit: I guess we use the same spice model for the panel ;-)
Jan
Attachments
Last edited:
Jan,
Yes, we are using the same model, the one made by undersigned, except for the addition of a somewhat strange diaphragm resonance circuit.
Is there a specific reason why you want to go in more detail?
Your original goal was motivated as to find out how much current should be provided by your direct drive amp with no transformers.
Aren't these plots giving a pretty good answer to this ?
Hans
BTW I am working on a DD amp, hence my measurements/questions.
Jan
Will this be SS or tube based?
If you would like to hear a working system you should listen to my set. It will give you an idea what DD is capable of... Subsonics, dynamics and 3D staging all in one...
Jan,
Yes, we are using the same model, the one made by undersigned, except for the addition of a somewhat strange diaphragm resonance circuit.
Is there a specific reason why you want to go in more detail?
Your original goal was motivated as to find out how much current should be provided by your direct drive amp with no transformers.
Aren't these plots giving a pretty good answer to this ?
Hans
Yes, I know the model originated with you. And the measurements they do give me a good answer, next step is to get the prototype(s) up and running at the real speaker!
Jan
I believe that in the case of direct drive, the drive voltage should be equalized according to the RED curve, which then also significantly lowers the maximum drive current requirement.
Am I right?
Jan
Yes, I think you are.
an,
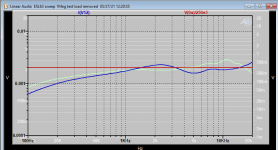
I have a bit of a problem with your voltage plots.
First image shows your voltage recording in red when driven from an amp.
Voltage has dropped from 350Volt@1Khz to 40Volt@20Khz, almost 19dB when I correctly read your plot.
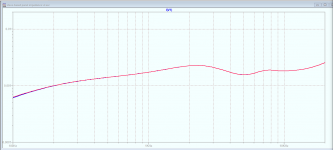
When running the simulation in the second image, there is a voltage drop of slightly less then 4dB.
This wasn't just the outcome of the simulation, but was backed up by many real measurements made by Steve.
So something in your voltage measurement is not correct.
The current on the other hand that you have measured does correspond quite well with the simulations for this situation as shown in #280, so nothing seems wrong with your ESL.
Hans
.
I have a bit of a problem with your voltage plots.
First image shows your voltage recording in red when driven from an amp.
Voltage has dropped from 350Volt@1Khz to 40Volt@20Khz, almost 19dB when I correctly read your plot.
When running the simulation in the second image, there is a voltage drop of slightly less then 4dB.
This wasn't just the outcome of the simulation, but was backed up by many real measurements made by Steve.
So something in your voltage measurement is not correct.
The current on the other hand that you have measured does correspond quite well with the simulations for this situation as shown in #280, so nothing seems wrong with your ESL.
Hans
.
Attachments
Last edited:
RE direct drive of an electrostatic.
The panel seems to be a pretty pure capacitor. However if it is then, A no power is dissipated in the panel and all the power (voltage X current between supply and load) is in the amp. Further the 90 degree phase shift meant that power is peak in the active devices- peak current at zero volts out. However there is no power getting transmitted to the air in this. Where does the converted power show and how? What phase relationship?
No one discusses the phase relationship of the acoustic out to the voltage in on either dynamic or electrostatic speakers. They cannot be the same.
Conceptually you could use 2-3 amps paralleled to drive the speaker through crossovers. One with higher current and lower voltage and one with higher voltage and lower current. Martin Logan did something similar with transformers. The actual conversion efficiency of an electrostatic can be quite high I read somewhere. Its a shame to blow it all in the amp.
Another option- a smaller high current amp floating on the output of the high voltage amp. With some frequency tailoring this could work. Similar stuff was in some Japanese amps in the previous millennia.
I believe the 2.2kHz hump in the modeled current is due to lack of including 2nd order parasitics in the model. The most prominent would be the stray coupling between the air-core inductors used in the transmission line which are placed quite close to each other. I seem to recall either Baxandall or Walker making mention of the coupling as have a smoothing effect. To test, I took the model Hans Polak developed and added a small amount of coupling (k=0.3) between adjacent inductors (1-2,2-3,3-4,4-5,5-6), and even smaller amount(k=0.1) between ever other inductors (1-3,2-4,3-5,4-6). I based these coupling factors on measurements of some 1mH aircore inductors of similar size and shape when spaced per the ESL63 PCboard.…And I still wonder why that 2.2kHz hump comes from.
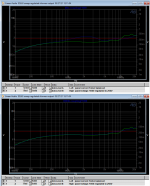
Attachment #1: You can see that this does indeed flatten the hump in the current curve
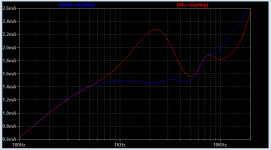
Attachment #2: Multiplying current by 1000 to represent voltage measured across 1Kohm in your measurement setup, a visual overlay with your plot from Post #279 shows much improved agreement.
(top is no coupling, bottom is with coupling)
NOTE: I’m not saying the k-values I used are correct, but I believe based on my measurements they should be representative. I was mainly interested in seeing if this small amount of coupling would move things in the right direction. Another indication that this coupling is on the right track, is that the modeled impulse response at the segments now have the pre-ringing seen in the measurements shared in Post #19
@Hans Polak,
If you incorporate this stray coupling into your model, the minor midrange hump in your modeled response shown in Post #265 should flatten out to match measurement even better.
Attachments
RE direct drive of an electrostatic.
The panel seems to be a pretty pure capacitor. However if it is then, A no power is dissipated in the panel and all the power (voltage X current between supply and load) is in the amp. Further the 90 degree phase shift meant that power is peak in the active devices- peak current at zero volts out. However there is no power getting transmitted to the air in this. Where does the converted power show and how? What phase relationship?
An ESL panel has a radiation resistance, just like antennas. It's just very small compared to the capacitive reactance.
If you wanted to reproduce only one frequency, you could tune out the capacitive reactance with a (preferably superconducting) series inductor (or two, to maintain symmetry) and have a really efficient speaker. The inductor(s) and panel capacitance would then also transform up the input voltage at that single frequency, so you wouldn't need a transformer or a high-voltage amplifier. Unfortunately it isn't much use for music reproduction.
By the way, the ESL-63 is pretty close to being resistive over most of the audio range, as the measurements show. Of course that's more than just a panel.
Conceptually you could use 2-3 amps paralleled to drive the speaker through crossovers. One with higher current and lower voltage and one with higher voltage and lower current. Martin Logan did something similar with transformers. The actual conversion efficiency of an electrostatic can be quite high I read somewhere. Its a shame to blow it all in the amp.
Another option- a smaller high current amp floating on the output of the high voltage amp. With some frequency tailoring this could work. Similar stuff was in some Japanese amps in the previous millennia.
According to Walker's equation, you need a frequency-independent current to get a flat far-field response out of a flat electrostatic loudspeaker. It neglects second-order effects such as the diaphragm resonance that affects the bass, diaphragm mass that leads to treble roll-off and the fact that most people have a floor, but still, it means that you need a substantial current as well as a quite high driving voltage to reproduce bass. How is your system going to provide that?
an,
I have a bit of a problem with your voltage plots.
First image shows your voltage recording in red when driven from an amp.
Voltage has dropped from 350Volt@1Khz to 40Volt@20Khz, almost 19dB when I correctly read your plot.
When running the simulation in the second image, there is a voltage drop of slightly less then 4dB.
This wasn't just the outcome of the simulation, but was backed up by many real measurements made by Steve.
So something in your voltage measurement is not correct.
The current on the other hand that you have measured does correspond quite well with the simulations for this situation as shown in #280, so nothing seems wrong with your ESL.
Hans
.
Hans, yes good catch. What I haven't done is to look at the amp output with constant input. It's an nCore class D module that I use as a test amp. I will look into that, but it will take a few days as I'm going to spend a few days at the beach ;-)
OTOH, if the current looks OK, the voltage should also be OK.
Jan
Last edited:
RE direct drive of an electrostatic.
The panel seems to be a pretty pure capacitor. However if it is then, A no power is dissipated in the panel and all the power (voltage X current between supply and load) is in the amp. Further the 90 degree phase shift meant that power is peak in the active devices- peak current at zero volts out. However there is no power getting transmitted to the air in this. Where does the converted power show and how? What phase relationship?
No one discusses the phase relationship of the acoustic out to the voltage in on either dynamic or electrostatic speakers. They cannot be the same.
Conceptually you could use 2-3 amps paralleled to drive the speaker through crossovers. One with higher current and lower voltage and one with higher voltage and lower current. Martin Logan did something similar with transformers. The actual conversion efficiency of an electrostatic can be quite high I read somewhere. Its a shame to blow it all in the amp.
Another option- a smaller high current amp floating on the output of the high voltage amp. With some frequency tailoring this could work. Similar stuff was in some Japanese amps in the previous millennia.
Demian, the ESL63 is nothing like a capacitor. See the schematic from Stephen in post 271. Others, like the Martin Logan's, are almost pure capacitances, but the various dampings on the diaphragm decrease the phase angle from the theoretical 90deg. You are quite right, some 'work' has to be done to generate acoustic output so they are not capacitance only.
Edit: I see Marcel has also chimed in on this.
Jan
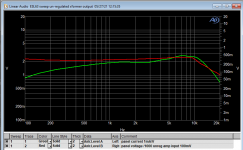
I believe the 2.2kHz hump in the modeled current is due to lack of including 2nd order parasitics in the model. The most prominent would be the stray coupling between the air-core inductors used in the transmission line which are placed quite close to each other. I seem to recall either Baxandall or Walker making mention of the coupling as have a smoothing effect. To test, I took the model Hans Polak developed and added a small amount of coupling (k=0.3) between adjacent inductors (1-2,2-3,3-4,4-5,5-6), and even smaller amount(k=0.1) between ever other inductors (1-3,2-4,3-5,4-6). I based these coupling factors on measurements of some 1mH aircore inductors of similar size and shape when spaced per the ESL63 PCboard.
Attachment #1: You can see that this does indeed flatten the hump in the current curve
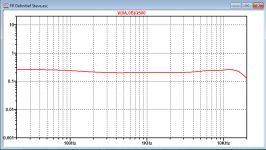
Attachment #2: Multiplying current by 1000 to represent voltage measured across 1Kohm in your measurement setup, a visual overlay with your plot from Post #279 shows much improved agreement.
(top is no coupling, bottom is with coupling)
NOTE: I’m not saying the k-values I used are correct, but I believe based on my measurements they should be representative. I was mainly interested in seeing if this small amount of coupling would move things in the right direction. Another indication that this coupling is on the right track, is that the modeled impulse response at the segments now have the pre-ringing seen in the measurements shared in Post #19
@Hans Polak,
If you incorporate this stray coupling into your model, the minor midrange hump in your modeled response shown in Post #265 should flatten out to match measurement even better.
That's great Stephen, we get another step closer to match simulation to measurements!
Jan
Last edited:
- Home
- Loudspeakers
- Planars & Exotics
- QUAD 63 (and later) Delay Line Inductors