In the distortion window the fundamental is at 0.00dBFS and also all the HD levels refer to that instead of the real fundamental level. Why is that?
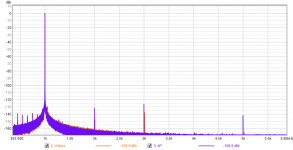
In the 3rd graph if referred to the real fundamental (-16.25dBFS) and without notch correction the 2nd HD is at -109.2+16.25-60=152,95dBFS and the 3rd is at -118.8+16.25-60=162,54dBFS. Assuming the notch correction at 2nd and 3rd makes these about 5dB higher these seem quite reasonable. However the 3rd HD seems a bit low so some HD cancellation may have taken place.
In the 3rd graph if referred to the real fundamental (-16.25dBFS) and without notch correction the 2nd HD is at -109.2+16.25-60=152,95dBFS and the 3rd is at -118.8+16.25-60=162,54dBFS. Assuming the notch correction at 2nd and 3rd makes these about 5dB higher these seem quite reasonable. However the 3rd HD seems a bit low so some HD cancellation may have taken place.
The intent was to have all results refer to the same base value.
Since we are dealing with HD, IMHO the choice reduces to two such values: FS of the ADC, or the signal value at the measurement setup input. For compatibility with my previous postings, I've chosen the former, thus the ordinate in terms of dBFS; otherwise the alternative reference would have been 2.20Vrms (oscillator output), and the units dBc.
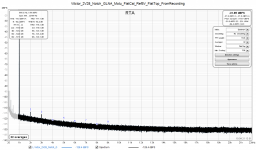
So the true value of the fundamental can only be seen in the first plot - the fundamental of 2.20Vrms is displayed by RTA as -7.01dBFS.
However, in all other plots the fundamental displayed by RTA can not be used as reference because it represents the signal value at the notch output multiplied by the LNA gain where appropriate. This value depends on the notch attenuation at the time of measurement, which I tried to keep at -70dB, but there is no guarantee for that, as it also happened in this very plot. So your assuming a fundamental of -16.25dBFS does not yield a correct result: for the 2nd harmonic, it is -109.2 - 60 = -169.2dBFS, and -159.2dBFS after the notch attenuation correction of +10dB, and -152.2dBc ref. 2.20V. Likewise, the 3rd has a value of -178.8dBFS before the notch correction.
Regards,
Braca
Since we are dealing with HD, IMHO the choice reduces to two such values: FS of the ADC, or the signal value at the measurement setup input. For compatibility with my previous postings, I've chosen the former, thus the ordinate in terms of dBFS; otherwise the alternative reference would have been 2.20Vrms (oscillator output), and the units dBc.
So the true value of the fundamental can only be seen in the first plot - the fundamental of 2.20Vrms is displayed by RTA as -7.01dBFS.
However, in all other plots the fundamental displayed by RTA can not be used as reference because it represents the signal value at the notch output multiplied by the LNA gain where appropriate. This value depends on the notch attenuation at the time of measurement, which I tried to keep at -70dB, but there is no guarantee for that, as it also happened in this very plot. So your assuming a fundamental of -16.25dBFS does not yield a correct result: for the 2nd harmonic, it is -109.2 - 60 = -169.2dBFS, and -159.2dBFS after the notch attenuation correction of +10dB, and -152.2dBc ref. 2.20V. Likewise, the 3rd has a value of -178.8dBFS before the notch correction.
Regards,
Braca
The intent was to have all results refer to the same base value.
Since we are dealing with HD, IMHO the choice reduces to two such values: FS of the ADC, or the signal value at the measurement setup input. For compatibility with my previous postings, I've chosen the former, thus the ordinate in terms of dBFS; otherwise the alternative reference would have been 2.20Vrms (oscillator output), and the units dBc.
So the true value of the fundamental can only be seen in the first plot - the fundamental of 2.20Vrms is displayed by RTA as -7.01dBFS.
However, in all other plots the fundamental displayed by RTA can not be used as reference because it represents the signal value at the notch output multiplied by the LNA gain where appropriate. This value depends on the notch attenuation at the time of measurement, which I tried to keep at -70dB, but there is no guarantee for that, as it also happened in this very plot. So your assuming a fundamental of -16.25dBFS does not yield a correct result: for the 2nd harmonic, it is -109.2 - 60 = -169.2dBFS, and -159.2dBFS after the notch attenuation correction of +10dB, and -152.2dBc ref. 2.20V. Likewise, the 3rd has a value of -178.8dBFS before the notch correction.
Regards,
Braca
No. The fundamental measured by the ADC after notch and LNA is at -16.25dBFS and this should also be the basis for the HD levels. So your calculation is incorrect. The real HD levels are 16.25dB higher.
Why?The fundamental measured by the ADC after notch and LNA is at -16.25dBFS
First plot – fundamental -7dBFS
Third plot – fundamental -7-69(notch)+60(LNA)=-16dBFS, but it is still -7dBFS on the oscillator output
2nd harmonic -109dBFs-60(LNA)+x(notch 2nd correction)= -169+10 = -159 ref fundamental
3rd harmonic -119dBFs-60(LNA)+y(notch 3rd correction)= -179+4 = -175 ref fundamental
Too good...
With REW, just use soundcard cal to measure the notch in loopback without LNA, then apply cal and set display in RTA to dBc and all should be good. Extreme notch depths are tricky, of course (high resolution required for the calibration extraction).
Assuming that the LNA loads the notch in the same way as the soundcard, fundamental and harmonics levels are displayed and calculated correctly.
The nice thing with this is that you don't even need to hit the notch exactly with the oscillator and the display and everything still remains correct.
I just remeasured Viktors vs AP with a simple untrimmed Hall-type notch (~50dB max attenuation, and about -44dB at the actual test frequency). No LNA though. The ADC (RME ADI-2 Pro FSR) was hit with ~-45dBFS (after notch) so its contribution is low (but probably not zero). The distortion of the notch is unknown (I'm using WIMA polyprops and off-the-mill metal films).
Comparing this to the measurement with AP (shown in #9493), things are not extremely off -- within the bounds of unkown distortion cancelling, notch filter distortion and unknown ADC distortion contribution. Sanity check running the ADC 15dB lower did show zero difference, so probably negligible.
Attachments
Last edited:
Why?
First plot – fundamental -7dBFS
Third plot – fundamental -7-69(notch)+60(LNA)=-16dBFS, but it is still -7dBFS on the oscillator output
2nd harmonic -109dBFs-60(LNA)+x(notch 2nd correction)= -169+10 = -159 ref fundamental
3rd harmonic -119dBFs-60(LNA)+y(notch 3rd correction)= -179+4 = -175 ref fundamental
Too good...
I made a mistake since I forgot that the notch is deeper than the LNA. Yes, the correct reference is the original fundamental (-7dBFS). However in the 3rd graph the HD levels in the distortion window are calculated from the 0dBFS instead so these are 7dB too low.
Based on this the 2nd HD in third graph is at -109+7-60+10=152dBFS and 3rd HD at -119+7-60+4=168dBFS. The 2nd HD makes sense but the 3rd HD is too low compared to other measurements seen on this thread.
However in the 3rd graph the HD levels in the distortion window are calculated from the 0dBFS instead so these are 7dB too low.
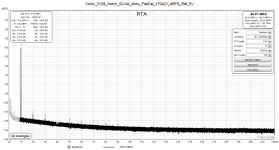
To clarify below are 2 REW RTA plots. In the first REW has found the fundamental and all HD levels are calculated against that, not against FS. The second plot is Braca's 3rd plot where the fundamental has been manually entered to 0.00dBFS. REW uses this as the reference and all HD levels are calculated against that, not the actual fundamental. And as the actual LDO output is at -7dBFS, the shown HD levels are 7dB too low.
Attachments
Hi Edmond,
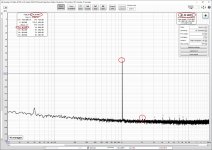
Spectral peak of -24.31dBFS at 999Hz is referred to the ADC FS, which is 5Vrms, and has thus a value of 0.305Vrms, i.e. 0.305mVrms at the notch filter output.
The notch attenuation of the input signal is thus 20*log(0.305E-3/2.28 = -77.5dB.
For compatibility with my earlier posts, the reference for the harmonics' levels was 5Vrms, thus the units dBFS in the THD box in RTA.
Regards,
Braca
Hi Braca,
As already told, I got 17.8mV RMS (or -31.98dBFS). With the best will in the world (by fiddling with a factor 5 and/or even sqrt(2) ), I can't rescale it to 0.305mVrms.
Normally, wav files are normalized to a peak value of +/-1.0. That is why Klaus (KSTR) also found this value (-31.95dBFS), see post #9476, while audio_tony found 35,1dBFS, see post #9478. Apparently the latter figure is based on a normalization to an RMS value of 1.0 instead of 1.0 peak. When normalized to +/5.0 peak, I should get 93.5mV or when normalized to 5.0 RMS, I should get 132mV. All these figures don't even come close to the results obtained by the current version of REW (i.e. 305mVRMS).
So what's going on here?
1. DiAna is wrong , or
2. REW is wrong, or
3. Something wrong with your wav file, or
4. I've overlooked something else.
Comments invited.
Cheers, E.
Last edited:
Hi Edmond,
I must extend your list of questions- there should a question #5, which reads "Did Braca use a wrong calibration file for the plots attached to the file link?".
The answer is "yes", and I apologize for having caused you so much trouble.
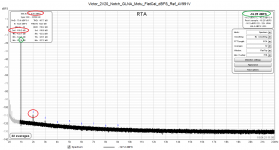
Attached is an evaluation of the file using a "flat" calibration referred to 5Vrms, which is the FS of my audio device. So the fundamental level after notch attenuation and amplification by 60dB is in now my evaluation -31.85dBFS, or 128mVrms, which is close to your value of 132mVrms ref. 5Vrms.
In terms of the notch attenuation, it yields -85dB.
Regards,
Braca
I must extend your list of questions- there should a question #5, which reads "Did Braca use a wrong calibration file for the plots attached to the file link?".
The answer is "yes", and I apologize for having caused you so much trouble.
Attached is an evaluation of the file using a "flat" calibration referred to 5Vrms, which is the FS of my audio device. So the fundamental level after notch attenuation and amplification by 60dB is in now my evaluation -31.85dBFS, or 128mVrms, which is close to your value of 132mVrms ref. 5Vrms.
In terms of the notch attenuation, it yields -85dB.
Regards,
Braca
Attachments
Hi Braca,
Thank you so much for clarification. Now I can proceed with your wav file. But what I am supposed to do with this file? Comparing harmonic levels, fundamental frequency variance, dependencies on FFT length, noise levels?
"In terms of the notch attenuation, it yields -85dB."
In that case I get for H2: -82.57 - 85 = -167.57dB (FFT length = 512k)
This figure stays well in accordance with your results in post 9473, right?
Cheers, E.
Attachments

Last edited:
H2 at -16x dBc, and higher harmonics even lower? No way I think this could be the actual distortion from a 5 years old Viktors. At some place some 20...30dB of correction went out of the window. Cancelling is extremely unlikely to just hit the sweet spot on all harmonics.
Hi Edmond,
My calculation looks a bit different:
- The THD table lists the 2nd harmonic at -115.8dBFS. The FS is 5Vrms.
- Since the calibration does not account for the notch attenuation, I must add 10dB and become(rounded) -106dBFS
- The true oscillator output voltage is 2.28Vrms (checked with a good AC voltmeter), which is -7dBFS, so the 2nd is now at -99dBc
Now we are at the critical step - we must account for the LNA gain, in my case 60dB. If I simply subtract 60dB from the 2nd level last calculated, it lands at -159dBc. This effectively means that the chain LNA -> ADC has a sensitivity of 5mVFS.
So I've been asking myself for quite some time whether this last step is correct.
I've not seen it being treated in papers or in this forum, but I don't claim to have performed an exhaustive search.
So I would really appreciate if someone had a reference or any other source of information.
Regards,
Braca
Last edited:
Account for LNA gain
Cheers, E.
There is nothing wrong with that.Hi Edmond,
My calculation looks a bit different:
- The THD table lists the 2nd harmonic at -115.8dBFS. The FS is 5Vrms.
[snip]
Now we are at the critical step - we must account for the LNA gain, in my case 60dB.
[snip]
This effectively means that the chain LNA -> ADC has a sensitivity of 5mVFS.
So I've been asking myself for quite some time whether this last step is correct.
[snip]
Regards,
Braca
Cheers, E.
Hi Braca,
This certainly sounds correct.
But why not simply characterize/calibrate the entire notch-LNA-ADC-software chain directly at the notch input and resolve the uncertainties?
Given your notch loss of about 10dB and LNA gain of 60dB, an appropriate calibration amplitude would be 50dB below the nominal Viktor oscillator output. I highly advocate Bob Cordell's "pilot tone" technique suggested in his earlier posts. His procedure inherently allows calibration with in situ generator source impedance pus it provides a convenient sanity/trouble shooting test.
Regards,
Steve
Now we are at the critical step - we must account for the LNA gain, in my case 60dB. If I simply subtract 60dB from the 2nd level last calculated, it lands at -159dBc. This effectively means that the chain LNA -> ADC has a sensitivity of 5mVFS.
This certainly sounds correct.
But why not simply characterize/calibrate the entire notch-LNA-ADC-software chain directly at the notch input and resolve the uncertainties?
Given your notch loss of about 10dB and LNA gain of 60dB, an appropriate calibration amplitude would be 50dB below the nominal Viktor oscillator output. I highly advocate Bob Cordell's "pilot tone" technique suggested in his earlier posts. His procedure inherently allows calibration with in situ generator source impedance pus it provides a convenient sanity/trouble shooting test.
Regards,
Steve
Last edited:
Thank you Edmond & Steve.
I don't have a problem with increasing the amplitude sensitivity by adding the LNA gain, but IMHO it only goes as far as that, i.e. any clean AC signal presented at the LNA input would appear with the correct level at the ADC input.
But in order to calibrate for distortion I must have either a 5mV signal with a known distortion at the LNA input, or such a signal in the Volt range at the notch filter input. A source like the Victor's, but then it's the one I'm trying to measure because I don't know its distortion.
In other words, are we able to quantify the lowest distortion measurable with a DIY system notch filter/LNA/ADC?
Regards,
Braca
In other words, are we able to quantify the lowest distortion measurable with a DIY system notch filter/LNA/ADC?
No argument with that. Once you have enough LNA gain so the noise from the notch-LNA rises 10 to 15dB above the ADC's noise floor, you've got plenty of LNA gain--- at least from a noise floor perspective. Best amplitude for distortion is a slightly different issue, but similar considerations apply and what's adequate for noise floor will likely be OK for signal residual distortion amplitude.
Last edited:
Per Bob Cordell's recommendation and my experience adding a marker is the best way to check the composite gains. It's how I confirmed the Shibasoku's levels in the post above. That was a first gen Victor at max out and the numbers are consistent with other measurements of contemporary examples.
Hi Braca,Thank you Edmond & Steve.
[snip]
In other words, are we able to quantify the lowest distortion measurable with a DIY system notch filter/LNA/ADC?
Regards,
Braca
So you are worrying about how much the distortion from te LNA and ADC will contribute (and disturb) the final readout of the HD levels, right?
With a LDO output of 2.28V an a notch depth of say -80dB, the fundamental at the LNA output (and ADC input) is 228mV. Such a level will certainly create some additional harmonics and will probably affect the HD measurement. But to what extent, that's the question.
Anyhow, I'm quite sure, you can't just ignore it.
Cheers, E.
- Home
- Design & Build
- Equipment & Tools
- Low-distortion Audio-range Oscillator