Calculating precise FFT for non-integer frequencies is quite complicated. In my distortion compensation I do the following:
1) FFT at samplerate length, i.e. integer-Hz precision, locating the fundamental(s) within 1Hz
2) Measuring exact non-integer frequency with nonlinear regression curve-fitting, using the rough frequency/phase provided by the FFT in previous step as initial values to make sure the fitting converges fast to correct values
3) Finding FFT length within <fs/2, several * fs> whose bins deviate least from the fundamental frequencies (i.e. also their harmonics too since those are just multiples) - simple minimum of sum of least squares for each FFT length
4) Running FFT at that length, yielding bins which are almost exactly centered on the required frequencies (all fundamentals + harmonics).
Bins fit precisely down to several 0.001Hz. Best-fitting FFT length varies wildly for even small changes in measured fundamentals which does not matter for my purpose where I need exact amplitudes and phases of harmonics in every measurement cycle. But I do not think this is feasible for a general purpose spectrum software like Arta which is interested in all frequencies, not only the harmonics (THD) and their combinations (IMD).
I did the regression by calculating scalloping response for 0, 0.1, 0.2,.. 0.5 offsets from bin-centre, looking up the distance by two highest bins, and then linearly interpolating between two adjascent offsets to find exact offset. If you do more offset steps for a lookup table, and interpolate in dB for amplitude, the result is quite precise.
Works with all window functions, if you precalculate the table for each of them.
Then it's either non-2^N FFT or resampling to fit 2^N samples.
So many ways to skin a cat 🙂
Works with all window functions, if you precalculate the table for each of them.
Then it's either non-2^N FFT or resampling to fit 2^N samples.
So many ways to skin a cat 🙂
Thank you phofman/s3tup for the detailed descriptions. Otherwise, I do not want to do a PhD thesis. It should only serve to quickly calculate the THD in a notch measurement setup. Maybe I'll add a few more features in the future.
s3tup - perfect, your solution sounds less CPU demanding and more suitable for an audio analyzer. I need very precise amplitude AND phase, do not trust linear interpolation of bins for phase info.
Poor cat 🙂
Poor cat 🙂
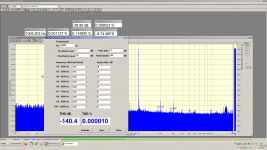
It is the level of the 1st harmonic after the notch filter. Read in the analyzer software (the big peak).
It is the level of the 1st harmonic after the notch filter. Read in the analyzer software (the big peak).
So what is 'Notch Depth' then used for? It is always the same value as 'Post Notch Level', so I have to type in the same stuff 2 times?
It seems Pre Notch Level and Notch Depth are enough to claculate. Please explain.
In order to calc THD you need to know the input gen level. You have to enter 2 values out of 4 values. I'll release a new version with more intuitive gui soon.
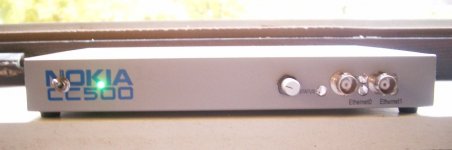
With my new tool, I finally measured my oscillator. Note the balanced output 🙂
Attachments
Last edited:
I think the confusion is partly on the legend. Like H2 = -110dB, referred to what?
Is that below 1V (dBV)? Then call it dBV. Is it below the fundamental, call it dBc. In both cases, you MUST know the pre-notch level to get the correct distortion level referred to the fundamental.
Jan
Is that below 1V (dBV)? Then call it dBV. Is it below the fundamental, call it dBc. In both cases, you MUST know the pre-notch level to get the correct distortion level referred to the fundamental.
Jan
It is not dBc. That is a weighting, It is dBr. Ref to fundemental.
What is decibels relative to reference level (dBr)? - Definition from WhatIs.com
THx-RNMarsh
What is decibels relative to reference level (dBr)? - Definition from WhatIs.com
THx-RNMarsh
Good point. dBc refers to power (spectrum analyzer), dBr to voltage and power. At the end of the day everything is dB. I'd rather say it's dBFS, because the values are read from a digital domain, namely the analyzer SW.
Last edited:
It is not dBc. That is a weighting, It is dBr. Ref to fundemental.
What is decibels relative to reference level (dBr)? - Definition from WhatIs.com
THx-RNMarsh
dBc (lowercase) is not C weighted, c is for carrier. It is relative to the carrier. Just about every single op-amp datasheet expresses it this way.
Good point. dBc refers to power (spectrum analyzer), dBr to voltage and power. At the end of the day everything is dB. I'd rather say it's dBFS, because the values are read from a digital domain, namely the analyzer SW.
What I mean is that 'dB' is a ratio. -100dB means a factor 10^-5 ratio between two quantities. That means that -100dB H2 is not very meaningful in itself unless it is refereed to the fundamental, at which point it becomes dBc - 2nd harmonic referred to the carrier (= fundamental).
So if your gadged shows a fundamental of -10dB, and an H2 of -100dB, does that then imply that the difference between fundamental and H2 is 90dB? Then you should say, H2 = -90dBc.
If you want to use dBFS, then what is the FS level? If H2 is -100dBFS, and your fundamental level is at -10dBFS, we know that H2 is 90dB below the fundamental. So again H2 = -90dBc, and if you say H2 = -100dBFS you imply that the carrier is at 0dBFS but that would conflict with your entry that fundamental = -10dBFS.
dB is an easy way to express things, but being a ratio, you need two parameters to make it meaningful.
Corollary: an easy way to 'fudge' your data with an AP or other analyzer is to show the distortion graph and then change the fundamental reference from 1V to 10V and presto! your distortion graph drops by 20dB. Sometimes you see people here trying that to show their stuff has -150dB distortion ;-) . The giveaway is that the top of the graph usually is hidden.
Jan
Last edited:
@Jan.Didden re post 7797
Thanks so much for adding some clarity to presentation of distortion data. I often see graphs that look enticing but miss key reference levels that make the results ambiguous. I often find I have to review earlier posts to guess at the test setup and try to intuit performance results. I don’t intend this as an attack on members’ data--- not recording key measurement levels is one of my own recurring failures.
My suggestion is that spectrum plots report reference calibration re the fundamental at the top of the graticule--- e.g. Top of screen is -50dBc. Taken from that perspective, it doesn’t matter if notch depth degrades a bit during measurement because distortion is assessed with respect to top of the screen. With FFT analysis , suppression depth of the fundamental is important in that it allows the A/D to measure distortion harmonics at its input without contributing significant distortion and noise of its own.
Other key setup data are the generator level (V rms or dBv) and enough details about the FFT to ascertain its resolution bandwidth. That would support measuring noise density re the generator level, e.g. dBc/sqrt(Hz).
No doubt I’m forgetting other key data.
- Home
- Design & Build
- Equipment & Tools
- Low-distortion Audio-range Oscillator