That looks fairly decent, the program has managed to sum the drivers accurately in the area you're wanting to introduce the xover.
I have to say your tweeter response is damned ugly above 10k. Here is how mine measures...

As you can see there's a nice smooth hump that reaches out to 15khz and as a result it is easy to flatten. My measurement also looks pretty much like what SEAS measures too.
As has been mentioned before the wave-guide should really help smooth out any abnormalities created by diffraction due to the interface between the uncountersunk tweeter and the baffle. Mine aren't countersunk perfectly, the tweeter is about 1mm proud of the cabinet front, but as you can see that has no real effect on the measured response.
Do you have anything else you can measure as a test? It's possible that some of what you're seeing is related to the measurement setup rather then the driver.
I have to say your tweeter response is damned ugly above 10k. Here is how mine measures...
As you can see there's a nice smooth hump that reaches out to 15khz and as a result it is easy to flatten. My measurement also looks pretty much like what SEAS measures too.
As has been mentioned before the wave-guide should really help smooth out any abnormalities created by diffraction due to the interface between the uncountersunk tweeter and the baffle. Mine aren't countersunk perfectly, the tweeter is about 1mm proud of the cabinet front, but as you can see that has no real effect on the measured response.
Do you have anything else you can measure as a test? It's possible that some of what you're seeing is related to the measurement setup rather then the driver.
Well, yours sure look better than mine, and it agrees well with the factory SEAS plot!
Actually, my measurement looked even worse earlier before Charlie suggested that the depression around the tweeter in the foam had some difraction effects..
Countersunk the tweeters in new foam, and that removed a very marked dip at 13K.
A good while ago, I measured on a conventional peerless tweeter, and got a result fairly consistent with the factory plot, and I don't believe ( I hope!) that I've broken something since then..
Anyway, as long as I can avoid any crazy dips/ peaks above 10K, I can live with some irregularities up there I think..
Oh.. seems LsP cad has frozen... 🙁
Anyway, as long as I can avoid any crazy dips/ peaks above 10K, I can live with some irregularities up there I think..
Agreed, I'd be interested in sorting out the area from the xover up to 10khz and simply ignoring what's above it. From your earlier posted measurements it seems you can get to fairly flat without having to do much faffing about, I think LspCAD is making it look perhaps, far worse then it actually is.
If you want to post your most recent measurements for the tweeter/woofer I could try having a bash at them.
Yes, it's probably eay to over-empahsize on details when looking at measurements and plots, those 1-2 dB dips and peaks look ugly if magnified enough! 🙂
Then there is the actual in-room response as well to consider which may make lesser imperfections even more irrelevant, especially above 10k.. ?
I have attached the latest and greatest raw driver and speaker responses (tweeter with 12,9 uF in series), so If you find that you can work some magick with these, I will of course be very glad to see what you come up with! 🙂
Not to mention comparing with my efforts to see how we approach things 🙂
Attachments
This was fun!
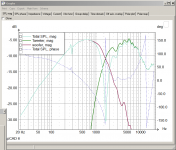
After doing the slope for the woofer, I had a go with the tweeter part of the XO.
Tried to set a 4th order LR target 1600Hz, but that didn't give any desired result, played around with the XO frequency a bit, but allways ended up with a dip arround 1500-1600 Hz..
Then I removed the slope constraint and set a level constraint in stead.
After a little cheving, the result was a fairly flat summation.
I then swithced tweeter polarity and got what I think looks like a very nice reverse dip.
I have attached graphs for both reversed and non-reversed.
Besides the HF roll-off, the nastiest feature left is a small dip at about 2800Hz, but this is fairly narrow and only 1-2 dB deep, something I believe must be of no real significance.
Allso, the resistor values remained within a reasonable range. If this is a response I can expect to get when implementing the optimized filter design, I guess this should be quite OK?
Attachments

Last edited:
I've just started to play with these. I don't know what your exact separation of your drivers are but I'd imagine 140mm isn't bad between the tweeter and mid/bass. But already you can see with -5.8mm on the Dz axis for the tweeter the measured and simulated combined responses are right on top of each other.
Now what the Dz parameter does is effectively alter the time alignment between the two drivers and is *very* sensitive to positioning and how you go about setting things up (this includes entering the mic distance and entering the piston diameter for the mid/bass) . This is why I like to fine tune my delay circuit by hand with the mic in the listening position.
Now what the Dz parameter does is effectively alter the time alignment between the two drivers and is *very* sensitive to positioning and how you go about setting things up (this includes entering the mic distance and entering the piston diameter for the mid/bass) . This is why I like to fine tune my delay circuit by hand with the mic in the listening position.
Attachments
I haven't looked in to the emulator yet, but I assume it would allow me to use the computer as the "x-over"?
Anyway, for purely practical reasons, I'm not able to rig up the computer and hook it up to the amplifier..
Have you tried??
Anyway, for purely practical reasons, I'm not able to rig up the computer and hook it up to the amplifier..
Have you tried??
I don't know if the emulator works in the demo version, I don't think it does. I've had a quick play with your files and have something decent done already, but I'm off to watch a TV program now, so I'll post with details later on.
Edit - what value caps are you using in your hp/lp filters?
Edit - what value caps are you using in your hp/lp filters?
I've just started to play with these. I don't know what your exact separation of your drivers are but I'd imagine 140mm isn't bad between the tweeter and mid/bass. But already you can see with -5.8mm on the Dz axis for the tweeter the measured and simulated combined responses are right on top of each other.
Now what the Dz parameter does is effectively alter the time alignment between the two drivers and is *very* sensitive to positioning and how you go about setting things up (this includes entering the mic distance and entering the piston diameter for the mid/bass) . This is why I like to fine tune my delay circuit by hand with the mic in the listening position.
Well, that looks pretty spot-on..
Distance between tweeter and woofer is 145 mm. so you got that one quite right! 🙂
Mic distance to baffle was 95 cm, and the tweeter VC/Diaphragm is approx 15 mm behind the baffle surface, corresponding for woofer is approx. 33 mm.
So allthogu you managed to match the measured and summed curves, the figures you used are not 100% similar to the real physical measurements.. is this significant, or doesn't it matter as long as the two curves are made to match??
I looked at the emulator last night and was fooled by the direct sound settings. It seemed to show the 8 channels available on my FW410, and recognizes that there is an ASIO device installed. However, I cannot select my FW410 as a device and actually play anything. It doesn't seem to work, but that could just be I don't know how to make it work.
Voice coil locations are a good starting point when looking for acoustic centers, but they aren't always a match.
Voice coil locations are a good starting point when looking for acoustic centers, but they aren't always a match.
It was disabled, or limited in functionality in the demo for 5.25. But then again the 6 demo can import your data files, something 5.25 did not allow.
Somehow the forum missed the edit I popped in where I asked for the cap values you're using in the high pass and low pass filters?
Somehow the forum missed the edit I popped in where I asked for the cap values you're using in the high pass and low pass filters?
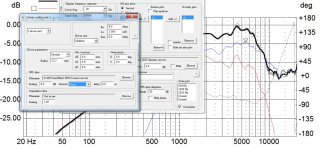
Had a quick play with your data for mic distance etc.
I had to alter the combined target spl by a small amount, but it ended up quite close enough.
You do not have to alter the Dz parameter for the woofer, leave that at zero. Then you alter the tweeters Dz parameter relative to the woofer.
The setting of the Dz, or phase/time parameter, is not absolute, it's simply the relationship between the two drivers, at the mic position and distance.
Attachments
Well, I will set the tweeter at 9mm Dz then! 🙂
Oh, by the way that was supposed to be 15nF, not uF in previous post!😱
Oh, by the way that was supposed to be 15nF, not uF in previous post!😱
The first thing that really requires attention is the effect of the wave guide on the tweeter.
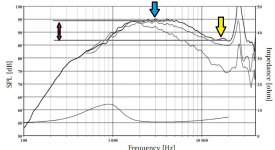
Lets look at the SEAS data-sheet again.

If we look at where the yellow arrow is positioned we can see here that the driver is somewhat 'flat'. This small section of the frequency response is where the wave guide you could say is having no influence, at least to the on axis SPL. If you were to draw a line backwards through the octaves this would represent the real world sensitivity of the driver if the wave guide didn't exist.
I have drawn in such a line and this shows that the tweeter would have a sensitivity of around 87dB.
The effect of the wave guide is what you see above this line, the gentle hump that is centred around 3.5khz.
What we need to do is remove this hump. The second grey line shows the difference between the two areas, this is about 7-8dB.
You will notice that in Mark Ks implementation he had to use a number of notches to sort out the frequency response. Luckily, if you go active it is somewhat easier to organise and you can get away with only 1.
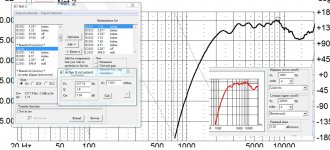
Here is the response with the notch filter detailed in the box.

Already you can see that is it much improved and if your tweeter didn't dip down a little more past 10khz, it'd be reasonably flat already.
Next we need to apply a high pass. And almost immediately you notice that the effect of the notch filter is causing a dip around 3khz so it needs to be modified somewhat. Letting LspCAD play it ends up with.

Lets look at the SEAS data-sheet again.
If we look at where the yellow arrow is positioned we can see here that the driver is somewhat 'flat'. This small section of the frequency response is where the wave guide you could say is having no influence, at least to the on axis SPL. If you were to draw a line backwards through the octaves this would represent the real world sensitivity of the driver if the wave guide didn't exist.
I have drawn in such a line and this shows that the tweeter would have a sensitivity of around 87dB.
The effect of the wave guide is what you see above this line, the gentle hump that is centred around 3.5khz.
What we need to do is remove this hump. The second grey line shows the difference between the two areas, this is about 7-8dB.
You will notice that in Mark Ks implementation he had to use a number of notches to sort out the frequency response. Luckily, if you go active it is somewhat easier to organise and you can get away with only 1.
Here is the response with the notch filter detailed in the box.
Already you can see that is it much improved and if your tweeter didn't dip down a little more past 10khz, it'd be reasonably flat already.
Next we need to apply a high pass. And almost immediately you notice that the effect of the notch filter is causing a dip around 3khz so it needs to be modified somewhat. Letting LspCAD play it ends up with.
Attachments
Very interresting... Looking at the FR with the notch implemented, it looks very much like what I can get by using a 12 dB oct shelf after I've set the HF XO and acheived a reasonalby flat response up to 6k (then starting to roll off)
As such, it looks like there is little difference between pulling down the waveguide hump with a notch and using a shelf to lift the HF roll-off..
using either shelf or notch filter, perhaps the only way to get a flat FR all the way up is to add a sharp notch (or peaking EQ) to add some boost around 15k? that is if it really matters...
- Status
- Not open for further replies.
- Home
- Source & Line
- Analog Line Level
- Shelving 2nd order high-pass?