What is flattened? The on-axis Response? What about the off-axis responses?There's a thread discussing DSP crossovers in the multi-way loudspeaker forum. One poster mentioned a method that includes flattening a driver +/- one octave around the bandpass prior to applying textbook crossovers (when using DSP). That made me wonder if using VituixCAD to design DSP crossovers (individually amplified drivers) uses a different measurement process than normally used to create passive crossovers. Is there any benefit to flattening drivers +/- one octave around the passband before taking measurements and importing them to VituixCAD; or is there a different measurement approach when the intent is to create DSP crossovers?
S. Linkwitz recommends to equalize for at least two octaves above and below the targeted crossover frequency.
I believe on-axis but I didn't ask. Here's the thread and my questions starting at post 64.What is flattened? The on-axis Response? What about the off-axis responses?
Hi... I am trying to merge gated farfield and nearfield for the first time, using VituixCAD, and I'm running into problems. I'm using ARTA. The driver is the Fostex FF225WK. I've not tried merging the port output, just the on-axis nearfield and on-axis farfield.
I've attached the nearfield and farfield PIR files below, and the FRD files generated from them using VituixCAD, in the ZIP here. I did the gated farfield with the ARTA gain setting at -1dB at a distance of 1 metre, and the nearfield with -20dB at about 5mm. I checked my mic preamp front panel (Focusrite Scarlett 2i2) and also the levels displayed by ARTA, there was no danger of approaching clipping with either signal.
There is a big difference between the farfield and nearfield levels when I'm merging -- I'm sure I'm doing something wrong. Many questions:
Basically, even after I enter the driver diameter in the Merger tool, I'm seeing a big level difference between the nearfield and gated farfield SPL levels. What am I doing wrong? Is there any chance you can try doing the merge with my data files and see if you get a more sane curve?
I've attached the nearfield and farfield PIR files below, and the FRD files generated from them using VituixCAD, in the ZIP here. I did the gated farfield with the ARTA gain setting at -1dB at a distance of 1 metre, and the nearfield with -20dB at about 5mm. I checked my mic preamp front panel (Focusrite Scarlett 2i2) and also the levels displayed by ARTA, there was no danger of approaching clipping with either signal.
There is a big difference between the farfield and nearfield levels when I'm merging -- I'm sure I'm doing something wrong. Many questions:
- I used a frequency sweep to do the nearfield measurements, instead of an MLS noise signal. The gated farfield was done using MLS. Is it right to do the nearfield using a frequency sweep?
- I seem to remember somewhere that VituixCAD can read the ARTA PIR files for merging, and if the two PIR files have been recorded with different gain settings in ARTA, then VituixCAD can pick up this data and scale the two readings correctly to get them in sync. But when I'm seeing the Merger tool, I'm not seeing any option to read PIR files -- it can only read FRD files, it seems. Which means VituixCAD can't know that the two have been recorded with very different gain settings, and therefore I need to enter either the driver diameter or area or some such data for the nearfield. Is this the way to do it?
- Over what frequency range must the merging be done? VituixCAD seems to default to half octave. I thought a larger range is better, like two octaves?
- The nearfield SPL I'm getting has these steps -- where are they coming from? The published curve has no such steps.
Basically, even after I enter the driver diameter in the Merger tool, I'm seeing a big level difference between the nearfield and gated farfield SPL levels. What am I doing wrong? Is there any chance you can try doing the merge with my data files and see if you get a more sane curve?
Attachments
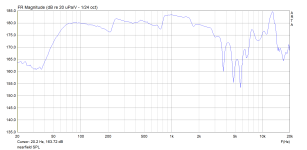
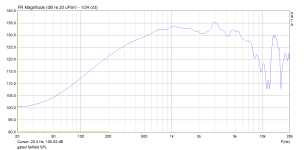
This is what I'm getting as gated farfield and as nearfield, from the two PIR files. See the steps in the nearfield file SPL, at 250 and 800Hz. What is causing this? They don't seem to be there in the published spec of the FF225WK.
Attachments
Member
Joined 2003
I have found ARTA to have issues at times with level and MLS, best to stick to periodic noise and sine sweep. Periodic noise provides better results than MLS anyway, and is less annoying than sine sweep, so it's a good choice for most situations. I only use sine sweep for low frequency response.
- I used a frequency sweep to do the nearfield measurements, instead of an MLS noise signal. The gated farfield was done using MLS. Is it right to do the nearfield using a frequency sweep?
No no no. VituixCAD has no idea of the "gain settings". the PIR file is just the raw measured impulse response. Use IR to FR tool to convert to frequency response. Refer to the measurement guide for ARTA:
- I seem to remember somewhere that VituixCAD can read the ARTA PIR files for merging, and if the two PIR files have been recorded with different gain settings in ARTA, then VituixCAD can pick up this data and scale the two readings correctly to get them in sync. But when I'm seeing the Merger tool, I'm not seeing any option to read PIR files -- it can only read FRD files, it seems. Which means VituixCAD can't know that the two have been recorded with very different gain settings, and therefore I need to enter either the driver diameter or area or some such data for the nearfield. Is this the way to do it?
https://kimmosaunisto.net/Software/VituixCAD/VituixCAD_help_20.html#How_to_start_with_VituixCAD
It is expected to adjust levels accordingly in the merge tool. Starting point can be completed from entering driver diameter, far field measurement distance, and adding -20dB from your comment above. I usually adjust the amplitude scale visually, it should be obvious if you have decent overlap from nearfield to farfield response.
You are asking about the "blending" region. If your measurements are good there should not be a need to blend. I've never adjusted from the detault, it is just there to prevent a hard step if you don't have perfect alignment.
- Over what frequency range must the merging be done? VituixCAD seems to default to half octave. I thought a larger range is better, like two octaves?
As for the specific merge frequency, the window of the far field measurement will dictate the lowest frequency with valid data. For nearfield, the driver diameter will dictate the highest frequency with valid data. See auxiliary -> neafield for details. Merge should be somewhere in between these two points. Use your best judgment from the measured data.
What is the cabinet? Did you put damping material in it? Response is typical for an empty box, you are measuring cabinet reflections.
- The nearfield SPL I'm getting has these steps -- where are they coming from? The published curve has no such steps.
Mic cal is required for final response. Near field is problematic due to cabinet interaction, so overlap is not really obvious.Basically, even after I enter the driver diameter in the Merger tool, I'm seeing a big level difference between the nearfield and gated farfield SPL levels. What am I doing wrong? Is there any chance you can try doing the merge with my data files and see if you get a more sane curve?
Thanks a lot for the detailed response.
Will take fresh measurements and try again. Let's see how it goes. But the bumps in the nearfield SPL are getting me quite foxed, quite apart from the rest of the problems.
- I'll try periodic noise instead of MLS next time, let's see if the levels turn out saner.
- Good you corrected me about the PIR file containing gain settings. I've used the IR to FR in VituixCAD and done the same in ARTA too, the first menu item under the ARTA "Analysis" tab. I guess I'll continue to do one of these.
- If PIR files don't have any memory of the ARTA gain setting, and if I'm using the cone area to get my gain adjustment, then this assumes that I've used the same mic and amp gains for both nearfield and farfield, right? Only then will the cone-area-correction do its job.
- Good to know that the default half-octave blending area is good enough. I won't worry about the width of the region now, I'll focus on getting the other things right.
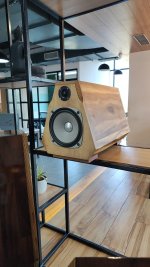
- You've asked about the cabinet. Photo attached. 😀 The inside is lined fully with 2" deep acoustic foam, used for treating recording studio walls, etc.
- Mic cal: I have a calibrated ECM800 XLR mic from Cross Spectrum Labs.
Will take fresh measurements and try again. Let's see how it goes. But the bumps in the nearfield SPL are getting me quite foxed, quite apart from the rest of the problems.
Attachments
Member
Joined 2003
I mention mic cal only because PIR file is just raw impulse response measurement, it does not include the calibration or any other settings. Calibration is applied during FFT process to convert to frequency response.
If it hasn’t been made clear enough, add damping material to the cabinet, you will see the change immediately in nearfield measurement. Just a guess that your cabinet depth internally is about 16”?
Dual channel measurement is really a differential measurement between mic input and the feedback reference, so the resulting amplitude is actually a differential between left and right input channels. With this in mind, if you adjust the level in software, the ratio between left and right channels has not changes, so the resulting amplitude is the same. You can test this yourself by simply taking 2 measurements at different levels and comparing. Adjusting input gain on your audio interface however will change the ratio and affect the measured amplitude. Play around with your own measurements to get a better understanding of the effects of adjusting the knobs and sliders.
You can expect the amplitude adjustment required between near and far field measurement to be signficant. I would not focus too much on it, just adjust amplitude scaling accordingly during merge process. With adequate measurement overlap it is easy.

Yes. In fact, I never bother with trying to make an area (Sd) adjustment to match NF to FF measurements. At a test voltage of 1 V I generally expect the FF measurements to be in the range of 80 dB, and the NF to be anywhere from 95 to 110 dB. During the Merger process I just scale the NF down to match the FF at the merge frequency.You can expect the amplitude adjustment required between near and far field measurement to be signficant.
Don't be discouraged. Making good repeatable measurements is one of the most challenging aspects of DIY speaker design. It would be rare to get it right the first time... or even the third time.
Hi guys.
previously I made a 2-way speaker using REW and X-Sim. I got a pretty good phase matching. Now I want to design a 4-way speaker using REW and VCAD. As I understand it, the approach to measurement and design is bit different. Here each speaker is measured on its own axis. Despite the large and good description, I would like to clarify some misunderstood nuances.
I am using REW for dual channel measurement.
In the manual says to set a delay of 2.907ms, which corresponds to a distance of 1m between the microphone and the acoustic center of the speaker.
It is difficult to maintain high accuracy at home. What tolerances can be considered acceptable? +- 1mm or more?
Can the "Estimate IR Delay" button be used to accurately calculate the measurement delay on the axis? Also, should this button be used for all other off-axis measurements or should the same value be left as for axis measurements?
Is it important to keep the same distance for all other drivers when I lower the mic to the axis level of the next speaker? Do I need to apply the Estimate IR Delay button at this point?
Member
Joined 2003
@gaga_r Moving from xsim to VituixCAD, you can create the exact same result with the same input and method, but without the added benefits of power & di & directivity that measuring full spatial information for each speaker provides.
To provide same result as Xsim, just leave driver coordinates at 0,0,0 in the crossover, and apply any delay necessary in the driver tab.
1m = 2.907ms is distance from mic to baffle surface, not any imaginary acoustic centre location. This is simply to remove the "time of flight" so phase information is more easily understood without a lot of excess phase. 1m distance accuracy is not strictly necessary, but a good general distance for most speakers measured in-room. At least 3x the width of the baffle is necessary to capture the baffle edge diffraction in the far field measurement. Just make sure that the timing offset is adjusted accordingly. "estimate IR delay" can be used to determine the delay to the impulse start, I would perhaps use just slightly less than this value for the measurement timing offset, to keep the impulse just ahead of t=0.
The most important thing is to keep the timing offset and distance from mic to baffle surface the same for all measurements to retain the timing information. +/- 1mm between measurements is a good goal. You will find with dual channel measurement that you can see the difference of moving the mic 1mm quite easily in the phase data, as well you can test with your own measurements how much of a difference that makes in the overall result.
@gaga_r - everything @DcibeL said... Here is another thing to consider: Small differences in distance, i.e. 20 mm or less, matter only at the higher frequencies. It is the tweeter/mid crossover that will be affected by small differences in mic-to-baffle distance. For example, at 500 Hz, 20 mm is equivalent to just 10 degrees of phase, which is almost meaningless. But at 3 kHz, 20 mm is equivalent to 60 degrees of phase, which is quite significant.
The VituixCad process allows us to use a common microphone position for a tweeter and a mid, provided the mid is small and reasonably close to the tweeter, they are vertically aligned, and the two drivers share the same baffle ( i.e they are in the same vertical plane). this is outlined in the users guide, and you should read it all in case I am missing something. The mic would be positioned on an axis that is midway between the tweeter and the mid.
By using a common mic position for the mid and tweeter, we reduce the possibility of a distance "time of flight" error creeping into the measurements. I have used this technique many times.
j.
Thanks for the quick response.
But in the manual of vcad I couldn't find how to determine the offset between the acoustic centers of the all drivers (especially important for the mid-tweeter), what the appropriate delay is and at what point it should be entered.
But in the manual of vcad I couldn't find how to determine the offset between the acoustic centers of the all drivers (especially important for the mid-tweeter), what the appropriate delay is and at what point it should be entered.
Last edited:
In XSim we use measurements with both speakers (mid-tweeter) connected in parallel. Then we find the delay using the combined graphs. Is a similar operation required in VituixCAD?
If we have followed the VituixCad guidelines correctly, the time delays between the various drivers (the "acoustic centers") is contained within the phase information of each driver. It is not necessary to determine the difference between acoustic centers.
With some software, the minimum phase response of each driver is used in simulation, and then we must explicitly account for the small offsets in the z direction. If we are using actual driver measurements, VituixCad is not intended to work that way.
The impulse response of a driver tells you how far away it is from the mic... If the tweeter impulse starts at 5.400 ms, and the midrange starts at 5.473 ms, the difference is 0.073 ms, which is 25 mm.
Thanks a lot
But keeping the same distance for all drivers between the microphone and the baffle is it necessary?
In practice, do I need to hit the button "Estimate IR Delay” at least first time?
But keeping the same distance for all drivers between the microphone and the baffle is it necessary?
In practice, do I need to hit the button "Estimate IR Delay” at least first time?
Last edited:
Member
Joined 2003
Hifijim already mentioned, with a dual channel measurement there is no need to "find" the acoustic center. The all important timing information is already captured in the measurement data, since all the measurements are made relative to a common timing reference. This is to say, if the mic distance to the baffle remains the same, and same window settings are used, you have already found the acoustic offsets in your measurements. If the baffle is flat, enter 0 for delay, enter 0 for driver z offset. Driver offsets in the crossover are the "physical" positional information only, not some fudge factor to fix measurement data with bad phase information like you would be used to with a single channel measurement.Thanks for the quick response.
But in the manual of vcad I couldn't find how to determine the offset between the acoustic centers of the all drivers (especially important for the mid-tweeter), what the appropriate delay is and at what point it should be entered.
You can forget about minimum phase, and should for the most part. Measured phase is more important and much more useful information.
Member
Joined 2003
This is a "single channel" process, and very limited in simulation capability. Most importantly, the delay value determined here applies only to the specific measurements provided, so you would have to repeat this process for each off axis angle, and provide a different delay to each off axis angle, which would be a horribly tedious process. It also limits your simulation to the mic distance, which can be problematic for larger speakers, the difference in response at 1m can be quite different from 2-3m typical listening distance. You can provide this simple process in VituixCAD, see my comment above about proving the same result as Xsim. VituixCAD provides a tool for this delay determination as well, found in the auxiliary menu.In XSim we use measurements with both speakers (mid-tweeter) connected in parallel. Then we find the delay using the combined graphs. Is a similar operation required in VituixCAD?
I attempted a document detailing the differences between single channel and dual channel measurement a while back, perhaps you will find it helpful:
https://www.htguide.com/forum/articles/do-it-yourself-diy/927364-single-vs-dual-channel-measurements
👍
And if tweeter is placing 20 mm behind mid, I need to move mic 20mm closer?
Or can I later enter 20mm offset in Z-axis?
And if tweeter is placing 20 mm behind mid, I need to move mic 20mm closer?
Or can I later enter 20mm offset in Z-axis?
Last edited:
The *.frd file contains separate phase information, as it was intended to hold non-minimum phase data. Even when the fundamental delay has been accounted for and even removed, a speaker measurement should not be expected to be minimum phase.With some software, the minimum phase response of each driver is used in simulation, and then we must explicitly account for the small offsets in the z direction.
- Home
- Design & Build
- Software Tools
- VituixCAD