Member
Joined 2003
If tweeter is mounted on a different baffle or a stepped baffle that is 20mm behind the mid baffle, do both. First, move mic 20mm to keep same distance mic to baffle. Second, z axis offset is physical offset.👍
And if tweeter is placing 20 mm behind mid, I need to move mic 20mm closer?
Or can I later enter 20mm offset in Z-axis?
Have you read through the measurement guide for REW?
https://kimmosaunisto.net/Software/VituixCAD/VituixCAD_help_20.html#How_to_start_with_VituixCAD
I think he means in the same design.If tweeter is mounted on a different baffle or a stepped baffle that is 20mm behind the mid baffle, do both. First, move mic 20mm to keep same distance mic to baffle. Second, z axis offset is physical offset.
In the same design you never move the distance of mic. It's all measured from the same reference.
The only variable that will be changed is the angle.
I highly recommend reading (studying) the VituixCad documentation.Have you read through the measurement guide for REW?
Even though I use ARTA rather than REW, I found it useful to read both the REW measurement guide and the ARTA measurement guide. The youtube videos are very helpful also.

Thanks a lot guys
After merging in VituixCAD NF and FF, how reliable is the output phase data?
I'm planning a very low crossing point around 80-120hz between woofer and low mid. So, this is a very important question for me because I would like to get the best possible phase-coherent alignment.
And right away another question. Is there any way to determine at home how much the woofer and low mid are phase-coherent after applying filters. I don't have an opportunity to measure on the outdoor area. If there is a phase difference 180, there will be a clearly detectable subtraction in the SPL and immediately audible to the ears. But if, for example, it's 30 degrees or 135, we're unlikely to be able to hear it.
I am well aware that it is impossible to measure low frequencies at home. But maybe there is some implicit way.
Member
Joined 2003
Output phase data is as reliable as input phase data. If you compare, you will find that the far field phase data is completely maintained and unmodified. The nearfield data is automatically delay adjusted to align phase with the far field data. You can manually adjust the delay to see the effect, but there really isn't any need to modify the value that is automatically calculated when you adjust the merge point. the result is a merged response with the same far field timing information as your original measurement.
For second question, phase of each driver is presented in top left chart when you bring the drivers into your project and connect them in the crossover. Problematic "coherence" will be visible in the SPL, power & di, and directivity charts as well.
Nearfield is how to measure low frequencies at home. Room interaction is another story.
@kimmosto , forgive me my lack of math experience. (I read the paper of Janne)^Yes, Ql is input parameter for calculating acoustic resistance of leaks (Ral), Qa is input parameter for calculating acoustic resistance of losses in the box (Rab) and Qp for resistance of port (Rap). Those resistances are calculated at system resonance frequency fb by enclosure compliance Ccab.
Link to white paper by Janne Ahonen. See pages 17-20 for example vented box, resistances on page 20. There is calculation example to many/most enclosure types found in Enclosure tool.
You can open acoustical equivalent circuit with calculated values to LTspice. Install LTspiceIV and specify path to scad3.exe in Options window. Open LTspice button is located in Info tab.
For closed box option in enclosure tool of Vituixcad how to determine the values for Qa and Ql?
F.i. if there is no air leak i think the Ql to be 100, and Qa also 100, correct?
If i add absorption in the non leaking box, the Qa should be lower than 100. If so how to determine how much?
Member
Joined 2003
You can expect that there is always some leakage, otherwise the cone of the speaker will move in and out with barometric changes as a permanent offset, and nobody wants that. There will be small leakage through the cone, around motor and voice coil, etc.
Determining the exact value can be difficult, to get some idea I would perhaps compare the measured impedance of your speaker with several levels of fill against the simulated impedance, as well as measured nearfield response, or use “mic in box” method. For best comparison make sure you are using measured T/S of your driver including extended Z.
For a general idea, 15-20 is low fill (lined walls), 7-10 is normal loose fill, heavy fill 3-5.
@DcibeL thanks for the reply. Reason asking is preparation of measurement with purifi 8" and special sheep wool filling.
The purifi is entirely closed(no leakage), the sealed test box is ging to be made with valchromat, also very closed, and i already foresee a pluggable opening to prevent overpressure during mounting.
The purifi is entirely closed(no leakage), the sealed test box is ging to be made with valchromat, also very closed, and i already foresee a pluggable opening to prevent overpressure during mounting.
What i ment that both driver and testbox are non-permeable. Normally f.i. a paper cone will allow some air passing through its fibrous structure etc. Normal MDF is also somewhat permeable. But the enclosures where the drivers will be mounted into eventually is non-permeable.
So to understand, the Qa will be quite low nummer wise.
I will measure the impendance etc with different amount of filling from 0 to too much.
To correlate the simulation with measurement i will manually need to alter Volume and Qa and Ql values to match.
Interesting!
So to understand, the Qa will be quite low nummer wise.
I will measure the impendance etc with different amount of filling from 0 to too much.
To correlate the simulation with measurement i will manually need to alter Volume and Qa and Ql values to match.
Interesting!
Measurement instructions:I think he means in the same design.
In the same design you never move the distance of mic. It's all measured from the same reference.
The only variable that will be changed is the angle.
Rotation center on Z-axis while off-axis measurement sequence:
a) Rotation center on Z-axis is common for all drivers if drivers are installed in straight non-stepped
baffle. Rotation center is typically on surface of front baffle for the tweeter. Z=0 mm for all drivers in
crossover simulation regardless of difference between baffle surface and acoustical center.
b) Rotation center on Z-axis varies with stepped baffle. Drivers on each baffle level has own rotation
center on Z-axis. Distance from each baffle level to microphone must be constant (1000 mm).
Differences on Z-axis are entered to the simulator as Z mm of the driver, e.g. tweeter Z=0 mm,
mid-range Z=-20 mm, woofer Z=-100 mm.
@kimmosto ,
Does this equal to your example?
1. measure the midrange and tweeter on the same flat baffle in a prototype.
2. In VituixCAD connect the appropriate matching filters to mid and tweeter. By changing the filter nominal values and changing the Z-axis distance (tweeter or mid), achieve the best possible matching of the SPL and phase. In the final enclosure, make a stepped baffle at the determined distance along the Z axis.
Is that correct?
- A.
is right ?If tweeter is mounted on a different baffle or a stepped baffle that is 20mm behind the mid baffle, do both. First, move mic 20mm to keep same distance mic to baffle. Second, z axis offset is physical offset.
- B.
If I plan to locate the mid at ear level and accept the center of the mids as the acoustic center of the speaker 0,0,0. The microphone should be positioned at the same level of the mids axis. Is it correct to set (from your example) tweeter Z=+20 mm, mid-range Z=0 mm, woofer Z=-80 mm ?b) Rotation center on Z-axis varies with stepped baffle. Drivers on each baffle level has own rotation
center on Z-axis. Distance from each baffle level to microphone must be constant (1000 mm).
Differences on Z-axis are entered to the simulator as Z mm of the driver, e.g. tweeter Z=0 mm,
mid-range Z=-20 mm, woofer Z=-100 mm.
Does this equal to your example?
- C.
1. measure the midrange and tweeter on the same flat baffle in a prototype.
2. In VituixCAD connect the appropriate matching filters to mid and tweeter. By changing the filter nominal values and changing the Z-axis distance (tweeter or mid), achieve the best possible matching of the SPL and phase. In the final enclosure, make a stepped baffle at the determined distance along the Z axis.
Is that correct?
Last edited:
If tweeterbaffle is say 20mm behind midrange, move mic upwards to be in line with tweeter, then move the box 20mm towards mic so that the mic tweeter distance is 100cm .
I'm learning VituixCAD while learning how to do crossovers. I posted a thread for the crossover in the Multiway forum and included the process I followed to generate a transfer file function equalization file.
It's on a speaker that includes an ATH waveguide. In the simulations, if I normalize to 10 degrees my 20/25 degree angles are consistent with 10 between 2kHz and 10kHz. Intent is home theater with side by side seating, toed in so listeners are at 10 and 20 degrees off-axis.
Is there a way to generate a transfer file equalized at 10 degrees rather than on-axis? Or should I EQ on-axis flat for the sake of the crossover and then EQ 10 degrees flat after the crossover is implemented.
Attachments
Wait, maybe I can just rename the measurement files. Decrement every angle by ten in the file name so that my 10 degree measurement is listed as 0 degrees. So now the question is whether or not I should do it or if it would ruin the crossover.
Wait...again...maybe I just change the reference angle at the top of VCAD to 10 degrees horizontal and that carries over into the transfer file function Optimizer.
Member
Joined 2003
Transfer function block uses whatever file you provide it, so I don't understand the question.
I'm referring to the Optimizer window with the Equalize with G(f) button to create a transfer file with Axial Response of Driver selected. If my waveguide is optimized for 10 degrees and 20 degrees is it better to make 10 degrees the axial response rather than zero?

Member
Joined 2003

Thanks for explaining how and why you optimize for Listening Window. I think the Help file explains how to Optimize for a specific angle (if I read the Help file correctly).
"Axial response of selected driver can be adjusted automatically to the target in SPL graph by selecting 'Axial response of Driver'. Select driver from list box on the right and then 'Axial response of Driver'. Create target curve, specify frequency range and select filter parameters/component values to be optimized from Parameters grid in Crossover tab. Driver's target magnitude is visible in SPL graph and target phase in GD & Phase graph. Start solver with Optimize button."
I understood this to mean you choose the reference angle located above the SPL graph. Then the Optimizer will optimize for that angle when the Axial response of Driver is selected.

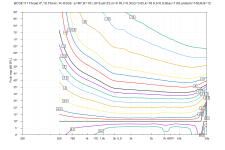
VituixCAD and my ATH horn simulation look like they match now.
10 Degrees
_10.png")

20 Degrees
_20.png")

"Axial response of selected driver can be adjusted automatically to the target in SPL graph by selecting 'Axial response of Driver'. Select driver from list box on the right and then 'Axial response of Driver'. Create target curve, specify frequency range and select filter parameters/component values to be optimized from Parameters grid in Crossover tab. Driver's target magnitude is visible in SPL graph and target phase in GD & Phase graph. Start solver with Optimize button."
I understood this to mean you choose the reference angle located above the SPL graph. Then the Optimizer will optimize for that angle when the Axial response of Driver is selected.
VituixCAD and my ATH horn simulation look like they match now.
10 Degrees
20 Degrees
- Home
- Design & Build
- Software Tools
- VituixCAD