Calculator tool has much larger span range so you can export SPL or filter response and load it to Calculator to visualize insignificant variations. Main program can show ca. 0.01 dB/px resolution as zoomed in so you really don't need narrower than 10 dB span.Is there any way in VituixCAD that I can adjust the vertical scale to cover a smaller range, such as one from 84dB to 86dB?

Thank you for the tip; it worked very well. 🙂
Although the variations were small, they were of a significant enough magnitude to warrant closer scrutiny. In any case, while performing a parameter sensitivity analysis using VituixCAD's circuit modeling capabilities, increasing the source impedance by a factor of four made the frequency response variations much more significant.
Although the variations were small, they were of a significant enough magnitude to warrant closer scrutiny. In any case, while performing a parameter sensitivity analysis using VituixCAD's circuit modeling capabilities, increasing the source impedance by a factor of four made the frequency response variations much more significant.
I'm not sure what you are referring to above. The following is what I see when I zoom in on just the frequency response plot. Is that to be expected? The plotted graph certainly doesn't fit the available window size.Main program can show ca. 0.01 dB/px resolution as zoomed in so you really don't need narrower than 10 dB span.
Aspect ratio Full uses whole window. 0.01 dB/px happens with maximized full HD resolution 1920x1080 and SPL span of 10 dB.I'm not sure what you are referring to above.
First of all, i'd like to thank kimmosto for making this program as it has teached me a lot of things about speaker building.
My question is: is there any way to align a driver in the "enclosure" tool with the crossover response taken from the main crossover page? I remember this option was available before the introduction of the "filters" section in the enclosure tool. I'm asking this as previously i could take advantage of the align function to simulate a closed box with an inline capacitor to extend the bass response, and in the last releases the software automatically updated the impedance response while varying box size and other parameters, therefore allowing to see changes to the response in real time whilst simulating the inline capacitor.
Thanks in advance!
I couldn't find the answer in this thread, so apologies if already answered.
Driver delay. Is a positive value further away from or closer to the mic?
Driver delay. Is a positive value further away from or closer to the mic?
Let's start by assuming that I am not using actual measured driver responses... for instance, maybe I traced the responses, or perhaps I am using idealized piston simulation. If a driver is behind the baffle (further away), account for this with the z dimension. positive is further away.
If I am using actual measured responses, and I have taken the measurements in accordance with the VituixCad procedure, the true path length to each driver is already accounted for in the measurement, so there is no need to adjust the Z dimension.
If I am simulating an active system and each driver has its own amp and DSP channel, I can apply a time delay to one or more drivers. When simulating a system such as this, I need to apply a time delay as part of the VituixCad simulation so that reality and simulation are in agreement.
j.
Thanks Jim. I'm fully aware of the measured vs. derived phase implications.
The VituixCAD manual says "positive or negative" - but doesn't say whether positive is away from or toward the mic (independent of which driver we are talking about, flat baffle, derived or measured phase etc...). In Speakerworkshop - negative Z is away from the mic
Adjusting Z is required as soon as we move away from measured phase. Such is the case when we are making our own quasi-anechoic responses for a full range simulation (or 3 / 4+ way where it is a must when splicing measurements). This is even more important with USB mics where an exact impulse cannot be determined due to USB timing volatility (and an XLR / dual channel setup is preferred).
So am I correct in assuming positive Z is away from mic?
yes, positive z is further from the mic.
I was a little confused because you asked about driver delay, which to me means time delay. The software allows us to simulate a time delay and/or a geometric z distance independent of each other.
So I was not sure I understood your question... sorry for stating the obvious regarding phase
I was a little confused because you asked about driver delay, which to me means time delay. The software allows us to simulate a time delay and/or a geometric z distance independent of each other.
So I was not sure I understood your question... sorry for stating the obvious regarding phase
Hey no problem Jim - my confusion.
I was literally referring to the label of the field on the driver tab:
as in Driver (tab) Delay:

I was literally referring to the label of the field on the driver tab:
as in Driver (tab) Delay:
Ah I see.
I am not sure if it make a difference, but I usually put the z dimension in the driver attributes in the crossover tab. Click on a driver, and you get the option to input x, y, and z...

I am not sure if it make a difference, but I usually put the z dimension in the driver attributes in the crossover tab. Click on a driver, and you get the option to input x, y, and z...
Member
Joined 2003
Yes, there is a difference. Delay in driver tab is meant for fixing incorrect phase in the frequency response files, it simply adds or subtracts delay to the phase of the driver response, nothing more. Best option to use for people with USB mics, entering value determined from Aux -> Time align.
Z dimension in crossover accounts for physical position of driver, so SPL vs distance to mic is considered, as well as angular interpolation if X and Y dimensions are entered.
In either case, Z axis polarity is as the picture Jim posted above.
Z dimension in crossover accounts for physical position of driver, so SPL vs distance to mic is considered, as well as angular interpolation if X and Y dimensions are entered.
In either case, Z axis polarity is as the picture Jim posted above.
With gratitude for this set of tools and what I've learned so far from using them, I have a question on the effect of Rg on application of standard alignments.
Here's an example with Rg = 0 (direct connection to low output impedance amp, short cable). This is QB3 alignment for the selected driver.

In reality, I'm anticipating a passive crossover with some pretty big inductors, so I allow 0.5 ohms and set Rg accordingly. I have auto-align checked and have verified that the traces are re-drawn.

With Rg > 0, volume and port tuning don't change, and accordingly there's a bit of a peak in the response just above the rolloff point. Some other tools (Unibox, Jeff Bagby's woofer box designer) compute modified driver parameters and then apply the Theile alignments.
I'm sure there's a reason for this choice in Vituix CAD. I'm interested in the recommended workflow when anticipating a passive crossover.
Thanks!
Here's an example with Rg = 0 (direct connection to low output impedance amp, short cable). This is QB3 alignment for the selected driver.
In reality, I'm anticipating a passive crossover with some pretty big inductors, so I allow 0.5 ohms and set Rg accordingly. I have auto-align checked and have verified that the traces are re-drawn.
With Rg > 0, volume and port tuning don't change, and accordingly there's a bit of a peak in the response just above the rolloff point. Some other tools (Unibox, Jeff Bagby's woofer box designer) compute modified driver parameters and then apply the Theile alignments.
I'm sure there's a reason for this choice in Vituix CAD. I'm interested in the recommended workflow when anticipating a passive crossover.
Thanks!
In working with shelving filters I need to translate to hardware what I configure in VituixCAD.
In hardware, the 3 Low/High shelf settings I have are frequency, gain, and slope. When I pick a shelf frequency in my hardware, that frequency is also the pivot point of the shelf at any slope in the settings. It is also the midway point for gain. The slope can be set for 3 – 15 dB/Oct. There is no ‘order’ selection like in VituixCAD.
In VituixCAD, the shelving frequency is not the pivot point, nor the gain midway point. In the 1st order low shelf, the gain midpoint is 3.19 x the Frequency selected. In the 2nd order low shelf, the gain midpoint and pivot point of the filter is 1.78 x the Frequency selected. The slope increases with increasing Q. 1st order and 2nd order shelf curves intersect at the selected frequency when the 2nd order Q is set at .707.
A 1st order, 1Khz Low Shelf configured in VituixCAD looks similar to a 3.19Khz Low Shelf, with a slope of 6, configured in my hardware.
I haven’t figured out if I can translate the 2nd order VituixCAD filters to the hardware.
Is there a way to relate Q to Slope? Perhaps I’m missing something in the VituixCAD manual. Another reference?
Thanks.
Perhaps stating the obvious, but have you checked if your hardware is on the list of supported DSP systems in VCAD?
Options > DSP system (dropdown).
Options > DSP system (dropdown).
Thank you Draki. Thankfully, my hardware is on the list. I had not picked it. Done now, and redoing the crossover.
I am wondering whether there is a best or recommended way of transferring IIR filters to SigmaStudio?
So far, I have found that I can
implies that there's something I'm missing.
Thanks for any tips!
So far, I have found that I can
- Select General as the DSP type and set the sample rate
- Create a General 2nd order filter in SigmaStudio with the required number of biquads
- In VCAD, in Copy Biquad Coefficients, select only value as decimal
- In SigmaStudio, right-click on the filter and choose Copy biquad coefficients
Code:
Main, Copy biquad coefficients
* Byte order of buffer:unmute as 8.24 hex reversed to be compatible with SigmaStudio.Thanks for any tips!
Last edited:
Active Buffer's Open parameter is compatible with this kind of component in SigmaStudio with data format of 8.24. For example invert is 0x00, 0x00, 0x00, 0x01 i.e. value=1 is in the last byte.implies that there's something I'm missing.
I've seen that in recent versions passive components in series to the speaker (capacitor, inductor and resistor) have been added to the filters tab in the enclosure tool, so this function is now available again (and works much better than before). Thank you a lot for this!First of all, i'd like to thank kimmosto for making this program as it has teached me a lot of things about speaker building.
My question is: is there any way to align a driver in the "enclosure" tool with the crossover response taken from the main crossover page? I remember this option was available before the introduction of the "filters" section in the enclosure tool. I'm asking this as previously i could take advantage of the align function to simulate a closed box with an inline capacitor to extend the bass response, and in the last releases the software automatically updated the impedance response while varying box size and other parameters, therefore allowing to see changes to the response in real time whilst simulating the inline capacitor.
Thanks in advance!
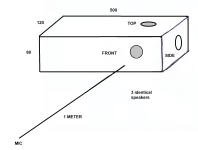
I want to simulate in vituixCAD the loudspeaker shown in the picture.
I have measured the Far field polar response of all the 3 drivers playing simultaneously at 1 meter .
I have also measured the near field response of each driver.
My question is how to make the Merging of Far field and Near field responses.
Should I use all three Near field responses with the BS active only for the Front driver?
For the diffraction should I use only the diffraction that is calculated for the front side?
Any other suggestion?
Attachments
- Home
- Design & Build
- Software Tools
- VituixCAD