Member
Joined 2003
Yes, if you change Ref angle, the TF output for "axial response of driver" will be completed against the ref angle, as you've found.

Hi guys, I've just started to measure my first pair of bookshelf speakers for the crossover calculation, using REW and following the guide from kimmosto (https://kimmosaunisto.net/Software/VituixCAD/VituixCAD_Measurement_REW.pdf).
In particular, I've done time referenced measurements, and I'm now importing them to VituixCAD, after having exported them as frd files. The only doubt that I have is, since I see just three columns: Freq(Hz) SPL(dB) Phase(degrees): how is VituixCAD deriving the timing delay from those files?
Should I have to manually insert the delay in the driver tab? Or is the delay automatically detected from the frd file heading?
This is my frd file heading:
Thanks in advence for your help!
In particular, I've done time referenced measurements, and I'm now importing them to VituixCAD, after having exported them as frd files. The only doubt that I have is, since I see just three columns: Freq(Hz) SPL(dB) Phase(degrees): how is VituixCAD deriving the timing delay from those files?
Should I have to manually insert the delay in the driver tab? Or is the delay automatically detected from the frd file heading?
This is my frd file heading:
- Measurement data measured by REW V5.20.13
- Source: IN 1-2 (BEHRINGER UMC 202HD 192k), LINE_IN (Volume master), R, volume: 0,880
- Format: 1M Log Swept Sine, 1 sweep at -12,0 dBFS using a loopback as calibration and timing reference
- Dated: 8-lug-2023 12.48.31
- REW Settings:
- C-weighting compensation: Off
- Target level: 75.0 dB
- Note: ; Delay 0,0841 ms (29 mm, 1,14 in) relative to Loopback as cal ref from LINE_OUT L to LINE_IN (Volume master) L with 2,9173 ms (1,001 m, 3 ft 3,4 in) timing offset
- Measurement: sb13pfcr25-08 hor 0
- Smoothing: 1/24 octave
- Frequency Step: 1/48 octave
- Start Frequency: 20.300 Hz
Thanks in advence for your help!
Member
Joined 2003
Delay is inherent to phase, as “excess phase”. If you have followed steps in the guide, keeping constant mic distance from baffle and measurement timing offset for all measurements then there is nothing more to do, delay is already captured in your files, driver coordinates in the crossover are physical offsets only.
What you are missing is the latest REW. You should notice the measurement guide for REW indicates latest 5.20.14 early access release is needed to fix some issues with “loopback as timing ref and cal”. Download here:
https://www.avnirvana.com/threads/v5-20-14-early-access-build.11154/
What you are missing is the latest REW. You should notice the measurement guide for REW indicates latest 5.20.14 early access release is needed to fix some issues with “loopback as timing ref and cal”. Download here:
https://www.avnirvana.com/threads/v5-20-14-early-access-build.11154/
Hi Kimmosto:
A couple of thousand posts ago, you gave me these instructions for modeling an OB driver:
^If you are using simulated omni-directional response data or off-axis measurements (0-180 deg) of boxed driver:
Typically baffle width / 2 + baffle thickness.
the above is consistent with what I see at e.g. the Linkwitz website and others on the web and makes intuitive sense.
There is also the check OB option in the diffraction tool, which doesn't require a Z parameter. One would expect the check OB model to agree with the 2 driver model when the Z parameter is representative of a thin baffle. However I have found the two models (both created using the diffraction tool and the same baffle) are in agreement only with Z=0. They diverge as Z is increased by small amounts representative of practical baffle and driver frame thicknesses. However when I increase Z to include the delta path difference, the models diverge greatly enough to make me question under what conditions, your original instructions are correct. If delta path isn't needed in the check OB model, perhaps it also isn't needed in the two driver model
A zip of the Vituix directory is attached.
A couple of thousand posts ago, you gave me these instructions for modeling an OB driver:
^If you are using simulated omni-directional response data or off-axis measurements (0-180 deg) of boxed driver:
- Add two drivers. Both have the same signal.
- Delay rear driver with Z mm parameter by sound travel distance
Typically baffle width / 2 + baffle thickness.
- Rotate rear driver 180 deg to aim it back.
- Invert rear driver."
the above is consistent with what I see at e.g. the Linkwitz website and others on the web and makes intuitive sense.
There is also the check OB option in the diffraction tool, which doesn't require a Z parameter. One would expect the check OB model to agree with the 2 driver model when the Z parameter is representative of a thin baffle. However I have found the two models (both created using the diffraction tool and the same baffle) are in agreement only with Z=0. They diverge as Z is increased by small amounts representative of practical baffle and driver frame thicknesses. However when I increase Z to include the delta path difference, the models diverge greatly enough to make me question under what conditions, your original instructions are correct. If delta path isn't needed in the check OB model, perhaps it also isn't needed in the two driver model
A zip of the Vituix directory is attached.
Attachments
Sorry about delay. Delta path including ca. baffle width/2 is needed with simulated omni-directional response data because that kind of data does not include delays due to baffle dimensions. Omni response is minimum phase and shape is constant to all directions. So omni data is far from reality and should not be used if more realistic data is available for simulation.However when I increase Z to include the delta path difference, the models diverge greatly enough to make me question under what conditions, your original instructions are correct. If delta path isn't needed in the check OB model, perhaps it also isn't needed in the two driver model
Dipole simulation with simulated or measured closed/vented box data contains delay of ca. baffle width / 2 to opposite side, and variable off-axis response due to cone dimensions and edges. You should add just Z difference of drivers to get total delta for dipole simulation.
Dipole simulation with Diffraction tool with Open baffle checked does not include any diffraction. It assumes that rear side of the baffle is 100% symmetrical with front side, and edge thickness is 0 mm. It just calculates response of (rear radiators) to 90 deg, inverts polarity and delays it with the shortest distance difference between center points of rear and front, and sums those two signals. Very simple, but limited compared to possibilities and features of electro-dynamic transducers in real life.
So, it's certain that those three methods give different results. Simulation with simulated closed/vented data with Z=0 and Diffraction tool with Open baffle checked should give quite close...exactly the same result.
I think it will be very helpfull, if there was a way in vituixCAD to simulate open baffle frequency response at the far field.
Maybe by taking the real near field response at the front and the rear of the open baffle, inserting the scheme with the baffle dimensions and then making the necessary calculations.
Is that possible?
Maybe by taking the real near field response at the front and the rear of the open baffle, inserting the scheme with the baffle dimensions and then making the necessary calculations.
Is that possible?
Thanks, Kimmosto. Its ironic that the diffraction tool model with OB checked doesn't include any diffraction. But of course, you do get diffraction without OB checked and that by its very definition includes the time for sound to travel across the baffle.
It seems to me that in a 2 driver model, you would need a Z on the rear facing driver to locate it in space and an equivalent time delay in the 2nd driver's signal to cover the time for the sound to travel through the baffle.
To be clear, this is how I'm simulating absent any measurements, in order to decide what to build and measure:
1. use diffraction tool generated directivity without OB checked
2. Instantiate two drivers one facing front and the second rotated 180 degrees to the rear and inverted
3. Rear facing driver gets Z= baffle thickness
4. Rear facing driver gets fed time delayed signal where delay is baffle thickness/speed of sound
This is, I hope, the least inaccurate model. Certainly good enough to predict SPL limits at the low end of the driver's range; perhaps good enough to give some idea of how far upwards the driver's range can be extended past the dipole peak with DSP equalization. Probably optimistic in that regard.
That would be very inaccurate method because actual directivity of radiating surface is not included. Just simulated ideal surface. Therefore it is not recommended though possible with VCAD. Recommended method is to measure actual directivity and merge NF with simulated directivity to bass range if measurement is not possible or too unreliable at bass range.I think it will be very helpfull, if there was a way in vituixCAD to simulate open baffle frequency response at the far field.
Maybe by taking the real near field response at the front and the rear of the open baffle, inserting the scheme with the baffle dimensions and then making the necessary calculations.
Is that possible?
For example, this is with measured data > 150 Hz, and simulated directivity+measured NF < 150 Hz.
Looks that you have double delay. Z alone creates delay of baffle thickness when diffraction is simulated with Open baffle unchecked.3. Rear facing driver gets Z= baffle thickness
4. Rear facing driver gets fed time delayed signal where delay is baffle thickness/speed of sound
Z creates delay of baffle thickness for rear wave traveling in positive Z direction
then time delay is (intended) for the delta path from the back edges of the baffle towards the listener
then time delay is (intended) for the delta path from the back edges of the baffle towards the listener
Main program calculates that automaticallythen time delay is (intended) for the delta path from the back edges of the baffle towards the listener
kimmosto
Hi
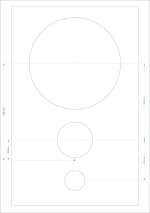
I have the position of the speakers on the front panel as shown in the picture. when measuring the tweeter and midrange I pointed the microphone at the center between the tweeter and midrange (red dot). the woofer I measured on its own axis. common sense tells me that I should set the woofer offset on the Y axis at 190mm, and zero offset for the tweeter and midrange.
Is this correct?
Attachments
This depends on what/how you measured. Measurement instructions says that you should measure (with time-locked dual channel method) at least whole horizontal plane 0-180 deg of all drivers. In that case you MUST specify individual Y for all drivers that program could simulate lobing/directivity in vertical plane.I have the position of the speakers on the front panel as shown in the picture. when measuring the tweeter and midrange I pointed the microphone at the center between the tweeter and midrange (red dot). the woofer I measured on its own axis. common sense tells me that I should set the woofer offset on the Y axis at 190mm, and zero offset for the tweeter and midrange.
Is this correct?
But if you measured both horizontal plane 0-180 deg and vertical plane 0-359 deg with common mic origin of M and T, you can specify Y=0 mm for both because measured phase responses include timing difference between the drivers (to all measured angles in vertical plane).
Measuring on-axis only (without off-axis) is not recommended because directivity/power/in-room features cannot be simulated, verified and controlled with crossover simulator. In that case both M and T could have Y=0 mm.
Read measurement and design instructions and follow them.
Last edited:
I am trying to model the effects of both amplifier source resistance and cable impedance on SPL response using a simulated two-way loudspeaker system impedance characteristic. The circuit I am using is shown below.

The results produced by the circuit are shown below, using a scale that ranges from 80dB to 90dB, with the nominal reference level being 85dB. This seems to be the minimum range that I can set.

Is there any way in VituixCAD that I can adjust the vertical scale to cover a smaller range, such as one from 84dB to 86dB?
Being able to do that would allow me to see the SPL variation much more clearly. Presently, the SPL variation is being plotted in a quite compressed manner, which is less than ideal.
The results produced by the circuit are shown below, using a scale that ranges from 80dB to 90dB, with the nominal reference level being 85dB. This seems to be the minimum range that I can set.
Is there any way in VituixCAD that I can adjust the vertical scale to cover a smaller range, such as one from 84dB to 86dB?
Being able to do that would allow me to see the SPL variation much more clearly. Presently, the SPL variation is being plotted in a quite compressed manner, which is less than ideal.
Can you explain why amp with cable sim is connected to driver like you do?
At first sight i find it confusing.
At first sight i find it confusing.
The "driver" is being used like a voltmeter, as the driver's Z value has been set to 10000 ohms. That way it will not affect the operation of the circuit. It's not expected to work the way a normal speaker does. In this application, I am interested in the change in voltage at the loudspeaker terminals based on whatever source impedance is set in the voltage source when driving the simulated loudspeaker impedance load, which looks like:

Last edited:
- Home
- Design & Build
- Software Tools
- VituixCAD