I 'm trying to simulate a cube box with 3 similar drivers as shown in the photo.
I think each driver should have the following coordinates:
X mm / Y mm / Z mm / R deg / T deg
0 / 0 / 0 / 0 / 0 -------- front
0 / 50 / 50 / 0 / 90 -------- Top
50 / 0 / 50 / 90 / 0 -------- Side
Is my understanding correct?
I think each driver should have the following coordinates:
X mm / Y mm / Z mm / R deg / T deg
0 / 0 / 0 / 0 / 0 -------- front
0 / 50 / 50 / 0 / 90 -------- Top
50 / 0 / 50 / 90 / 0 -------- Side
Is my understanding correct?
Attachments


I measured the polar response of a small subwoofer which is connected through a bluetooth transceiver.
The issue is that when I convert IR to FR in vituixCAD, the reference time of the impulse is not the same between the measurements, probably to different delays inserted by the bluetooth receiver.
It is from 256msec to 265 msec (beginning from the measurement start).
I wonder what is the best way to convert the IR to FR.
To convert one by one measurement seems the correct way.
But what about phase?
Should I go for minimum phase after the conversion?
Any thoughts?
Without a reference signal, that is why dual channel setups is requird, you will not get good results.
According to those that know minimum phase is a sort of rough guestimation to put it simple. So not really a solution.
According to those that know minimum phase is a sort of rough guestimation to put it simple. So not really a solution.
Member
Joined 2003
Assuming you are measuring dual channel, reference channel feedback needs to be located at the speaker itself, so wireless bluetooth chain is included in the feedback loop.
Another option would be to remove the bluetooth portion for measuring the speakers. Connect audio output to amp to speaker directly like you normally would.
Another option would be to use REW with acoustic timing reference, though setup becomes a lot more fiddly to maintain.
Another option would be to remove the bluetooth portion for measuring the speakers. Connect audio output to amp to speaker directly like you normally would.
Another option would be to use REW with acoustic timing reference, though setup becomes a lot more fiddly to maintain.
Thanks for your replies.
The measurements have be taken with CLIO and unfortunately it is not possible to be taken again, since the subwoofer is not available.
Any possible suggestions if something can be done with the existing measurements?
The measurements have be taken with CLIO and unfortunately it is not possible to be taken again, since the subwoofer is not available.
Any possible suggestions if something can be done with the existing measurements?
You can alter the timing , can you show a screencopy of the vituixcad ir 2 fr window you use?
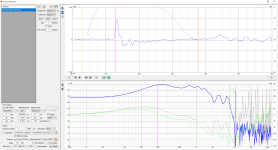
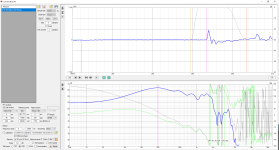
Here are two examples for Hor 0 deg and Ver +90 deg.
I have convert eack IR to FR, separately one by one by choosing the correct reference time.
But, I wonder if this is correct concerning the phase response and if something else should be done.
I have convert eack IR to FR, separately one by one by choosing the correct reference time.
But, I wonder if this is correct concerning the phase response and if something else should be done.
Attachments
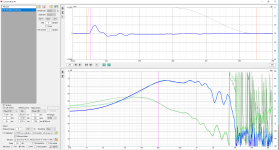
To improve the calculated frequency response results, at the very least I'd adjust the left window to be "rectangular", and the right Tukey window to be "0.25" instead of "0.5". Those changes will allow more of the low-frequency signal to get through without window-associated attenuation, noting that getting accurate low-frequency response estimates requires impulse response records that are long.
I see no difference if I set the left window to "rectangular", and the right Tukey window to "0.25" instead of the default settings.To improve the calculated frequency response results, at the very least I'd adjust the left window to be "rectangular", and the right Tukey window to be "0.25" instead of "0.5". Those changes will allow more of the low-frequency signal to get through without window-associated attenuation, noting that getting accurate low-frequency response estimates requires impulse response records that are long.
See attached photo.
Have you tried and seen different results?
Attachments
The part of that instruction that is applicable is the ir2fr part. Follow those steps. The delay is large but the ir2fr takes care of it. The only worry i have is that the bluetooth delay is not a constant actoss all ypur measurements. But do as the instruction says. Load the measurements (from 0 to 90), set the ir2fr up for the 0 degree measurement and run it.
The difference is there, just that it's quite small. The left Tukey window is being applied to a low-response region (the ambent noise in the room) prior to the impulse response of the driver. A left rectangular window should be used, such that it captures the very start of the impulse response. Any data that is prior to the start of the impulse is of no value, and just works to reduce the signal to noise ratio of the measurement. Hence, it should be set to zero.I see no difference if I set the left window to "rectangular", and the right Tukey window to "0.25" instead of the default settings.
See attached photo.
why does your current passive crossover network no longer apply in the enclosure tool? How do I review preliminary baffle step correction now? it was useful for that.
I agree, this is a nice feature, why to remove it?
I used it to see the excursion of the woofer after applying equalization.
I used it to see the excursion of the woofer after applying equalization.
There's a thread discussing DSP crossovers in the multi-way loudspeaker forum. One poster mentioned a method that includes flattening a driver +/- one octave around the bandpass prior to applying textbook crossovers (when using DSP). That made me wonder if using VituixCAD to design DSP crossovers (individually amplified drivers) uses a different measurement process than normally used to create passive crossovers. Is there any benefit to flattening drivers +/- one octave around the passband before taking measurements and importing them to VituixCAD; or is there a different measurement approach when the intent is to create DSP crossovers?
Member
Joined 2003
There is not.is there a different measurement approach when the intent is to create DSP crossovers?
- Home
- Design & Build
- Software Tools
- VituixCAD