Hi,
I have just stumbled across this thread. Please allow me to tell about my point of view regarding the STransform.
IMO the STranform is a useful tool, of course it is necessary to know a bit what you can do with (like with any other tool).
So a STransform of a pulse response shows pretty well what is going on. IMO better than a waterfall plot.
So please see an example (the first 20 ms around the direct sound arrival). The white curve shows the frequency response of the direct sound.
The frequency is plotted from back to front, the time is running from left to right.
It is possible to create different views, different colors and different scales of course.
Best regards
Uli
I have just stumbled across this thread. Please allow me to tell about my point of view regarding the STransform.
IMO the STranform is a useful tool, of course it is necessary to know a bit what you can do with (like with any other tool).
So a STransform of a pulse response shows pretty well what is going on. IMO better than a waterfall plot.
So please see an example (the first 20 ms around the direct sound arrival). The white curve shows the frequency response of the direct sound.
An externally hosted image should be here but it was not working when we last tested it.
The frequency is plotted from back to front, the time is running from left to right.
It is possible to create different views, different colors and different scales of course.
Best regards
Uli
Hi,
I have just stumbled across this thread. Please allow me to tell about my point of view regarding the STransform.
IMO the STranform is a useful tool, of course it is necessary to know a bit what you can do with (like with any other tool).
So a STransform of a pulse response shows pretty well what is going on. IMO better than a waterfall plot.
So please see an example (the first 20 ms around the direct sound arrival). The white curve shows the frequency response of the direct sound.
An externally hosted image should be here but it was not working when we last tested it.
The frequency is plotted from back to front, the time is running from left to right.
It is possible to create different views, different colors and different scales of course.
Best regards
Uli
Any change of getting the wav option working? Or how about importing an impulse from a txt file?
Do you remember what size/kind of room and where the sound source and mic was located? If I only wanted to look at the first 0.5ms, can the resolution provide any usefull information?Hi,
I have just stumbled across this thread. Please allow me to tell about my point of view regarding the STransform.
IMO the STranform is a useful tool, of course it is necessary to know a bit what you can do with (like with any other tool).
So a STransform of a pulse response shows pretty well what is going on. IMO better than a waterfall plot.
So please see an example (the first 20 ms around the direct sound arrival). The white curve shows the frequency response of the direct sound.
An externally hosted image should be here but it was not working when we last tested it.
The frequency is plotted from back to front, the time is running from left to right.
It is possible to create different views, different colors and different scales of course.
Best regards
Uli
1. In the moment I have not implemented reading wav and txt files (though it is not difficult). The main purpose is to investigate in pulse responses and basically I get them from Acourate as dbl-files. Maybe I'll expand to wav and txt if I find some time some day
2. The recording of the example has been carried out in a room of size 8.4 x 4.6 x 2.5 m at the listening position about 3.5 m from the front wall. The pulse clearly shows reflections from a table and the ceiling.
A 2 ms detail is shown in the picture
Again you see the frequency response at the pulse start by the white curve (the dip at 300 Hz is caused by the crossover and an Allison cancellation) and in addition you can see the max. amplitudes by the black curve. Do you detect the similarity to the group delay caused by the passive crossover?
Uli
2. The recording of the example has been carried out in a room of size 8.4 x 4.6 x 2.5 m at the listening position about 3.5 m from the front wall. The pulse clearly shows reflections from a table and the ceiling.
A 2 ms detail is shown in the picture
An externally hosted image should be here but it was not working when we last tested it.
Again you see the frequency response at the pulse start by the white curve (the dip at 300 Hz is caused by the crossover and an Allison cancellation) and in addition you can see the max. amplitudes by the black curve. Do you detect the similarity to the group delay caused by the passive crossover?
Uli
The detailed analysis of both time and frequency is limited, known as Heisenberg-Gabor inequality, see for example the link
So the picture shown before does not allow more precise details (anyway it is not bad at all, isn't it?). You may either look just at the time domain (pulse response) or at the frequency domain /amplitude/phase response) to get more detailed information.
IMHO it makes sense to carefully think about this: if there is no proper mathematical method to have a detailed instantanous information of time and frequency then would our brain be able to do this? No. Thus we do not hear all the details under time and frequency aspects.
Uli
I think it would not be sensible to think what the human can identify is linmited by what math models seem to suggest, Wavelett Transforms can properly identify HOM problems in horns, I look at CSD to find problem areas in a driver. I'm just wondering what S-transforms does better in identifying problem areas. Seems like it's good for room problems.
IMHO it makes sense to carefully think about this: if there is no proper mathematical method to have a detailed instantanous information of time and frequency then would our brain be able to do this? No. Thus we do not hear all the details under time and frequency aspects.
Uli
Thats certainly a point to keep aware of.
Whether we "hear" in frequency or in time or in whichever mixture is the main and never ending question.
That we possibly may adjust our "hearing / analysis" in one or the other way or even being able to switch between listening patterns by training makes things even more complicated.
Lynn has mentioned several times people that do not appreciate stereo presentation and concluded that this persons may suffer from a lack of stereo perception.
Also there were studies that people do not equally emphasis on base notes and overtones - there seem to be distinct groups.
This makes me wonder how CMP behaviour - where "distortion" is *always* "at the beginning and the end" - could possibly be characterized in terms of perception.
For sure its not as black and white as CMP "distortion" suggests - hence I better like to use the term "CMP framing".
Anyway, its always just kinda ECHO effect
Michael
Hi Michael,
Here's a special "CMP wavelet" calculated from the impulse response of a small two way box in a room.
Here the wavelet length is 5ms. It's interesting to see how comb filtering pattern changes everytime wavelet enters new reflection and exits previous reflection.
LOL But check this out.. Something wierd happening below 1kHz. The two comb filtering patterns starting at 2.5ms merge as one at 6ms! Now please provide us with a new three letter acronyme describing this effect 😀
- Elias
In time frequency plots CMP becomes obvious as seen in my old pretty pix of decay in steps:
...
Wavelet analysis would certainly be even more pin point
🙂
Michael
Attachments

Don't hold your breath! It took me years to arrive at CMP concept and I don't have my crystal ball at hand right now...
😀
By the way - the pix enlargement does not seem to work ?
(edit: does work now, beautiful and impressive pix for "time line inconsistent spectral distribution" ("TILINSPEDI" 😀 😀 😀 😀 😀 😀 😀 😀 😀 😀 😀) ! what do we look at actually and where is XO frequ set ?)
Michael
😀
By the way - the pix enlargement does not seem to work ?
(edit: does work now, beautiful and impressive pix for "time line inconsistent spectral distribution" ("TILINSPEDI" 😀 😀 😀 😀 😀 😀 😀 😀 😀 😀 😀) ! what do we look at actually and where is XO frequ set ?)
Michael
Last edited:
Now please provide us with a new three letter acronyme describing this effect 😀
- Elias
... beautiful and impressive pix for "time line inconsistent spectral distribution" ("TILINSPEDI" )...
In case you do not feel for 10 letter acronyms, but insist on three, I'd suggest "WTN"

"Walk through the night"
🙂
Michel
Last edited:

Seems like we finally found a use for CMP and Wavelet transform combination.😀In case you do not feel for 10 letter acronyms, but insist on three, I'd suggest "WTN"
"Walk through the night"
🙂
Michel
Let us know when there will be an art exhibition.
Hello,
I generated a new wavelet to investigate the "time varying frequency content". I call it constant Q step. It is a step with exponential rise having the length proportional to wavelength (constant Q) and followed by a constant envelope thereafter.
Looks like this on ideal impulse:
Testing it with my ideal reflection work horse impulse response:
http://dl.dropbox.com/u/2400456/diyaudio/Ideal_reflections_16bit_44100.wav
It looks like this:
It features the temporal aspects (time between 0 to 5ms where reflections occur) as well as the Fourier transform frequency response which can be read from the top of the figure (t = 20ms in this case).
For comparison the Fourier transform of the impulse response:
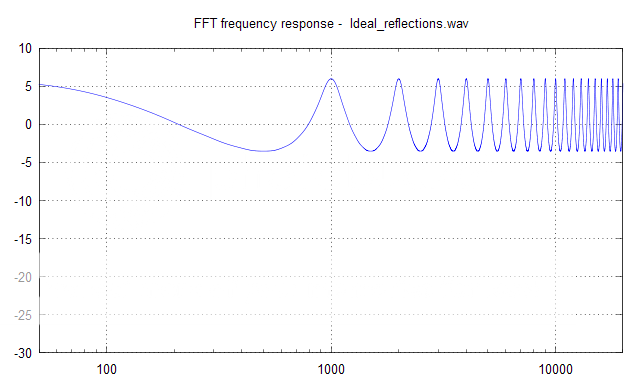
- Elias
I generated a new wavelet to investigate the "time varying frequency content". I call it constant Q step. It is a step with exponential rise having the length proportional to wavelength (constant Q) and followed by a constant envelope thereafter.
Looks like this on ideal impulse:
An externally hosted image should be here but it was not working when we last tested it.
Testing it with my ideal reflection work horse impulse response:
http://dl.dropbox.com/u/2400456/diyaudio/Ideal_reflections_16bit_44100.wav
It looks like this:
An externally hosted image should be here but it was not working when we last tested it.
It features the temporal aspects (time between 0 to 5ms where reflections occur) as well as the Fourier transform frequency response which can be read from the top of the figure (t = 20ms in this case).
For comparison the Fourier transform of the impulse response:
- Elias
It becomes more interesting when considering a real life case with measured loudspeaker in a room.
Here a small two way box at 1m distance in a normal living room:
There the loudspeaker response can be seen at time 0 to 4ms before reflections occurs. Below 2kHz there is some diffraction effects seen.
After 4ms is room effects with the loudspeaker response. Interesting is for example at 30ms where the room mode at 150Hz splits into two.
Again the Fourier transform frequency response can be read at the top of the figure (at t = 50ms or later).
- Elias
Here a small two way box at 1m distance in a normal living room:
An externally hosted image should be here but it was not working when we last tested it.
There the loudspeaker response can be seen at time 0 to 4ms before reflections occurs. Below 2kHz there is some diffraction effects seen.
After 4ms is room effects with the loudspeaker response. Interesting is for example at 30ms where the room mode at 150Hz splits into two.
Again the Fourier transform frequency response can be read at the top of the figure (at t = 50ms or later).
- Elias

Looks like a fine tool !
In comparison - could you also do a plot of an ideal response plus ideal EQing +6dB Q2 at say 1000 Hz and an other plot with Q10 +6dB at 1000 Hz - just to show how the "normal case" looks like in time frequency plots ?
Michael
Hi,
What is an "ideal EQ"? Can you express the transfer function?
- Elias
What is an "ideal EQ"? Can you express the transfer function?
- Elias
Looks like a fine tool !
In comparison - could you also do a plot of an ideal response plus ideal EQing +6dB Q2 at say 1000 Hz and an other plot with Q10 +6dB at 1000 Hz - just to show how the "normal case" looks like in time frequency plots ?
Michael
Hello,
Interesting read. Written in 1991 😱 and now two decades later it has became practical reality 😀 😎
- Elias
Beyond Frequency Response:
A New Approach to Audio Measurement via Wavelets
Beyond Frequency Response: A New Approach to Audio Measurement via Wavelets
Interesting read. Written in 1991 😱 and now two decades later it has became practical reality 😀 😎
- Elias
Beyond Frequency Response:
A New Approach to Audio Measurement via Wavelets
Beyond Frequency Response: A New Approach to Audio Measurement via Wavelets
Elias,
what do you think about the picture of your ideal reflection work horse made by STransform?
The axes are arranged like in your examples.
Best regards and a Happy New Year 🙂
Uli
what do you think about the picture of your ideal reflection work horse made by STransform?
An externally hosted image should be here but it was not working when we last tested it.
The axes are arranged like in your examples.
Best regards and a Happy New Year 🙂
Uli
- Status
- Not open for further replies.
- Home
- Loudspeakers
- Multi-Way
- WTF!? Wavelet TransForm for audio measurements - What-is? and How-to?